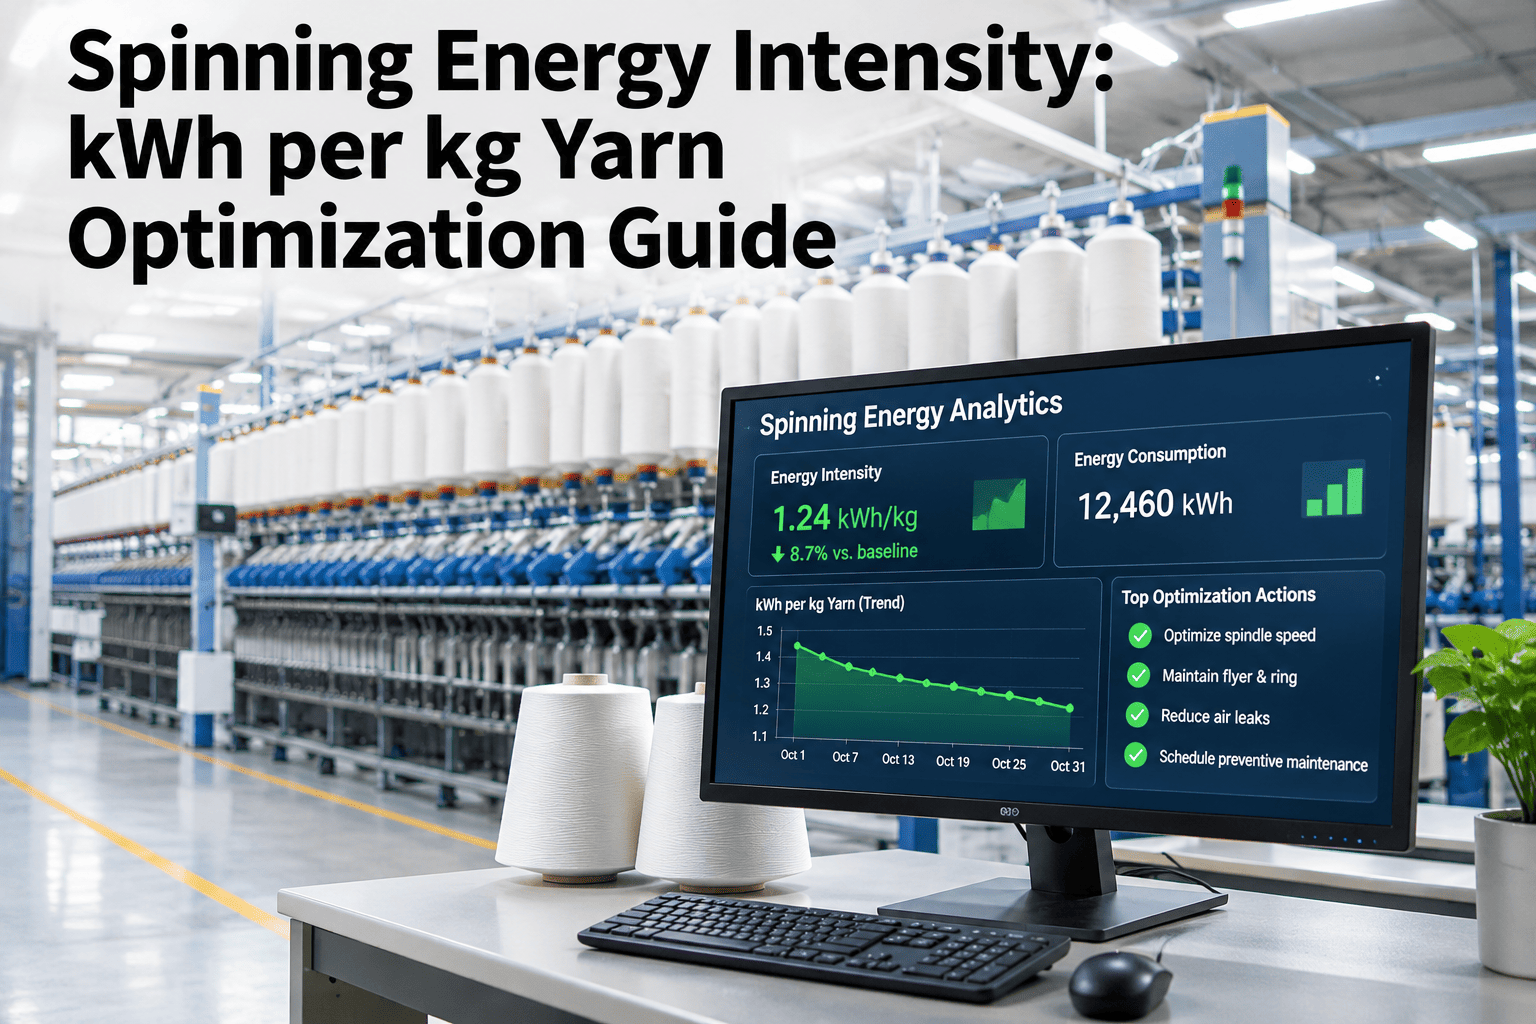
Spinning accounts for approximately 34% of a composite textile mill's total energy consumption — the largest single department load — yet most mills manage it with a monthly electricity bill and a production weight report that are never compared at machine level. The result is an energy cost that is accepted as a fixed cost of the count mix, when in practice it varies significantly by spindle speed, motor loading, production efficiency and machine condition. A spinning frame running at 65% motor load efficiency consumes 15–20% more energy per kilogram of yarn than the same frame optimised to 85% — with no visible difference in the production report. kWh per kg yarn is the metric that makes this variation visible, connects it to the factors that drive it, and identifies the specific machines and operating conditions where energy savings are achievable. Teams that want to see this analysis built for their own spinning floor can book a session with iFactory AI.
Measure kWh per kg Yarn by Frame — Find the Energy Gap Hidden in Your Spinning Floor
iFactory AI connects spinning electricity metering with production output, spindle speed, motor loading and machine condition to reveal energy intensity by frame, count and shift — and identify the specific improvements that reduce kWh per kg without affecting yarn quality.
What Is Spinning Energy Intensity and Why Does It Vary?
Spinning energy intensity is the electricity consumed per kilogram of yarn produced on a ring frame, expressed as kWh per kg. It is the standard unit for comparing spinning energy efficiency across frames, counts and time periods — independent of production volume or run duration.
Energy intensity in ring spinning typically ranges from 3–5 kWh per kg yarn, with fine counts and high-speed frames at the upper end and coarser counts at lower speeds at the lower end (UNIDO / iFactory Energy Benchmarks, 2026). Within any given count on any given frame, however, the actual kWh per kg varies with motor loading efficiency, spindle speed setting, yarn break rate, and machine condition — and that within-count variation is where the actionable savings are found. A spinning floor managing energy by total monthly consumption misses this variation entirely; one managing it by kWh per kg per frame can identify and address specific sources of inefficiency before they accumulate in the electricity bill.
The Four Drivers of kWh per kg Variation
Energy intensity varies across frames for four distinct reasons. Identifying which driver is responsible for a specific frame's elevated kWh per kg determines what action to take — and whether the responsibility sits with engineering, maintenance or production planning.
Find Out Which Frames Are Consuming Energy They Shouldn't — and Why
iFactory AI connects spinning electricity meters with production output, break rate, motor load and machine condition — producing kWh per kg by frame and identifying the specific driver behind every inefficient machine.
Setting Count-Specific Energy Intensity Targets
A single kWh per kg target for the whole spinning floor is not useful — a fine count will always consume more energy per kilogram than a coarse count, regardless of efficiency. Useful energy targets are set per count range, as the gap between current actual kWh per kg and what the best-performing frames running the same count are achieving.
| Count Range | Typical kWh/kg (current) | Best-in-class target | Primary saving lever |
|---|---|---|---|
| Ne 10–20 (coarse) | 2.8–3.5 | 2.5–3.0 | Motor loading; break rate; speed optimisation |
| Ne 20–40 (medium) | 3.5–4.5 | 3.2–4.0 | VFD retrofit on oversized motors; break rate reduction |
| Ne 40–60 (fine) | 4.5–6.0 | 4.0–5.2 | Speed profile optimisation; bearing condition; break rate |
| Ne 60+ (extra fine) | 5.5–8.0 | 5.0–6.5 | Break rate is dominant; fine counts amplify the energy cost of every break |
Frequently Asked Questions
What metering is needed to track kWh per kg by ring frame?
The minimum requirement is a sub-meter per ring frame or per 2–3 frame cluster, combined with per-frame production weight records. Where frame-level metering is not installed, iFactory AI uses department-level metering with production allocation to produce frame estimates, and identifies which frames most need dedicated meters. Review your current metering setup in a session before any commitment.
How is kWh per kg affected when a frame changes counts during the measurement period?
iFactory AI tracks the active count on each frame from the production schedule and applies count-specific energy targets for each period — so the kWh per kg calculation is always compared against the target for the count actually running, not a flat fleet average. Ask our team how count changes are handled in the energy intensity calculation.
Can energy intensity data be used to build the case for a VFD or motor upgrade?
Yes. For frames consistently above target kWh per kg with motor loading identified as the primary driver, iFactory AI calculates the annual energy saving from a VFD retrofit or motor replacement — producing the ROI figure that makes the capital case to management. See how the motor upgrade ROI calculation is structured from your frame energy data.
How does the system distinguish count-driven energy intensity from efficiency-driven intensity?
Count-driven intensity is calculated from the theoretical energy floor for the count — based on spindle speed, yarn linear density and motor efficiency curves. Actual kWh per kg above this floor is the efficiency gap. iFactory AI reports both: the theoretical floor and the gap, with the gap decomposed into break rate, motor loading and machine condition components. Ask our team how the gap decomposition is displayed for each frame.
Can kWh per kg data be included in product cost calculations?
Yes. Per-frame kWh per kg, combined with the electricity rate, gives an energy cost per kg for each count — which flows into product cost calculations alongside material, labour and overhead. iFactory AI integrates with production costing systems to include measured energy intensity as a live cost input rather than a standard rate. See how energy cost flows into product costing in a live walkthrough.
Stop Accepting the Spinning Energy Bill — Start Understanding It Frame by Frame
iFactory AI measures kWh per kg yarn by ring frame and connects every inefficient frame to its specific energy driver — count, motor load, break rate or machine condition. Book a session built around your spinning floor data.