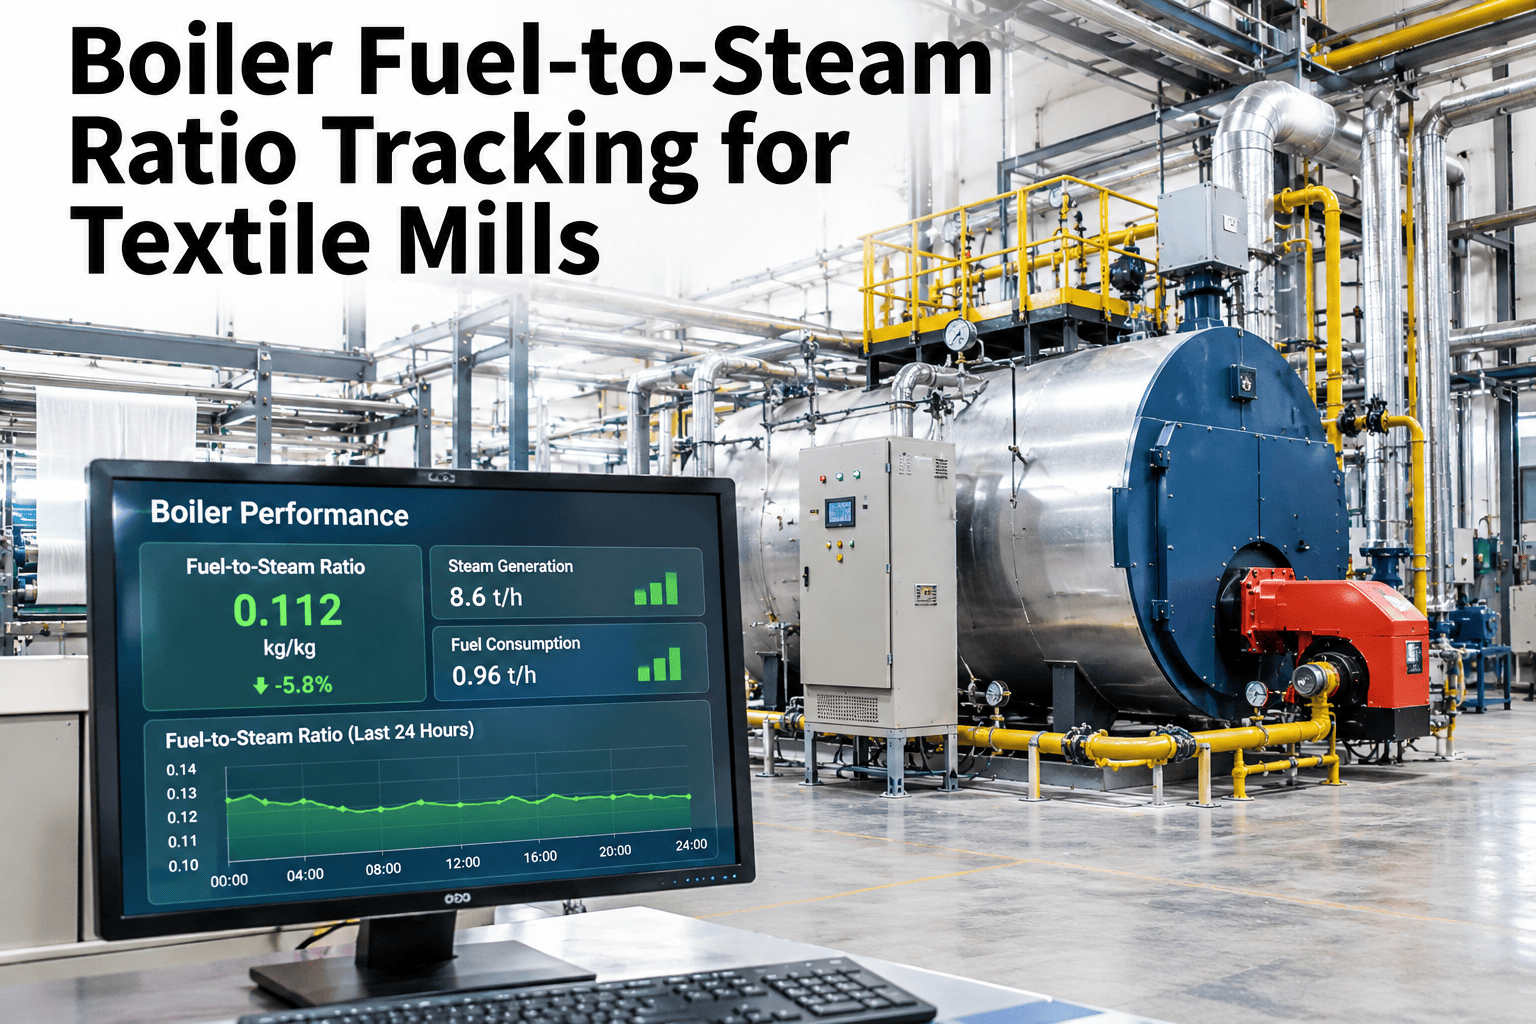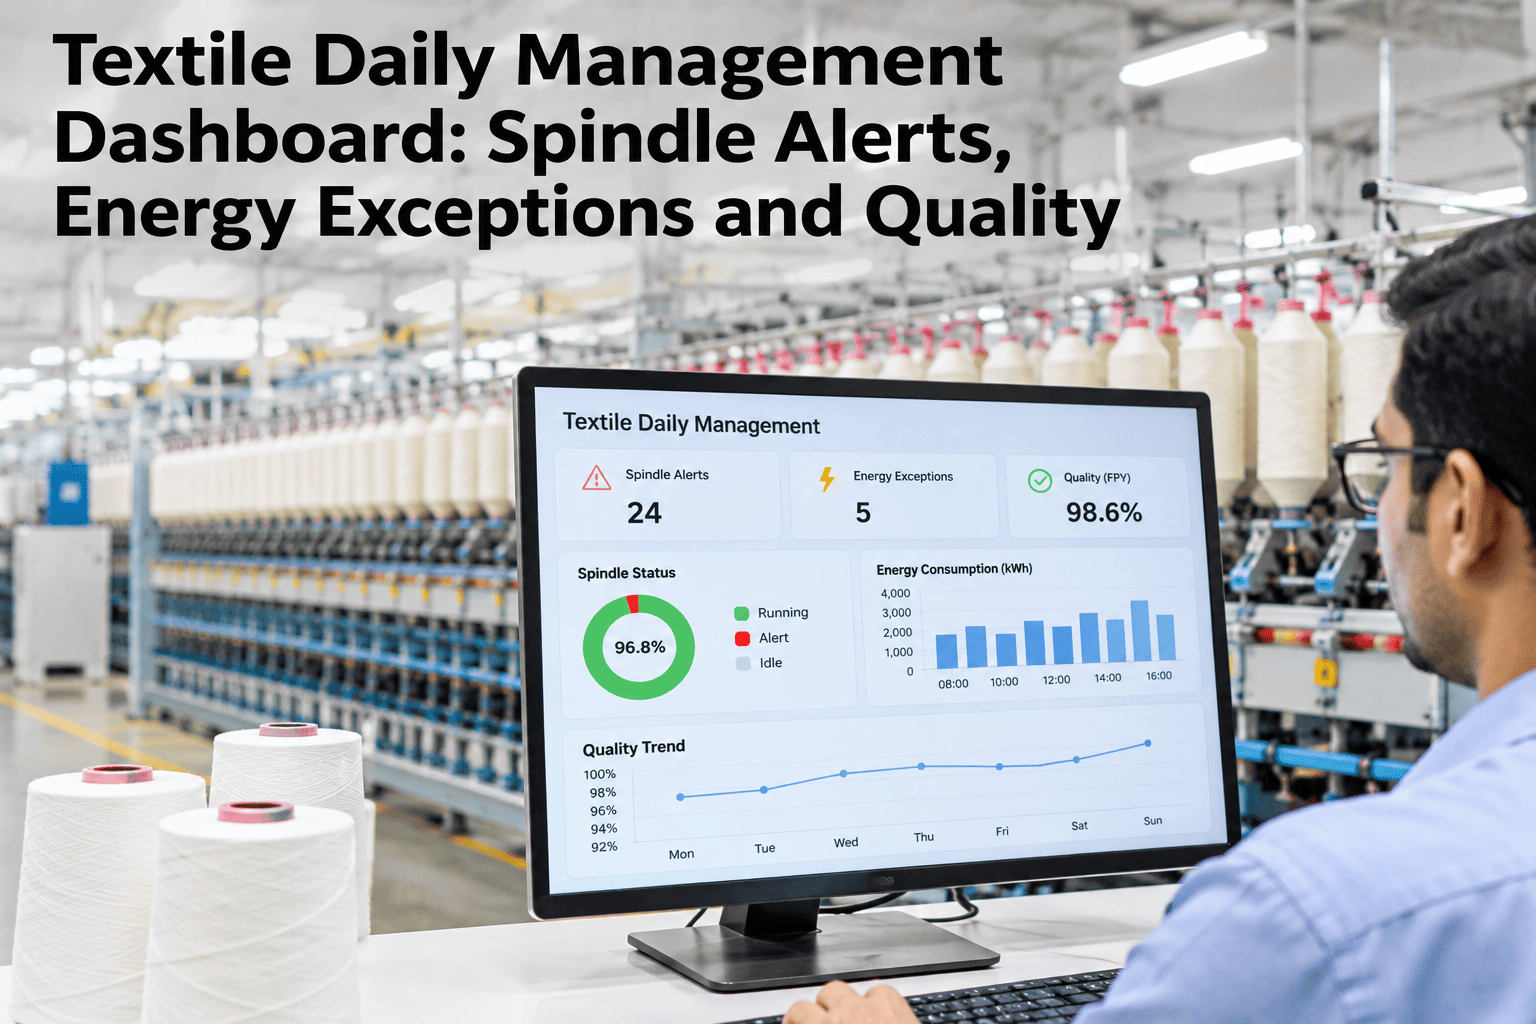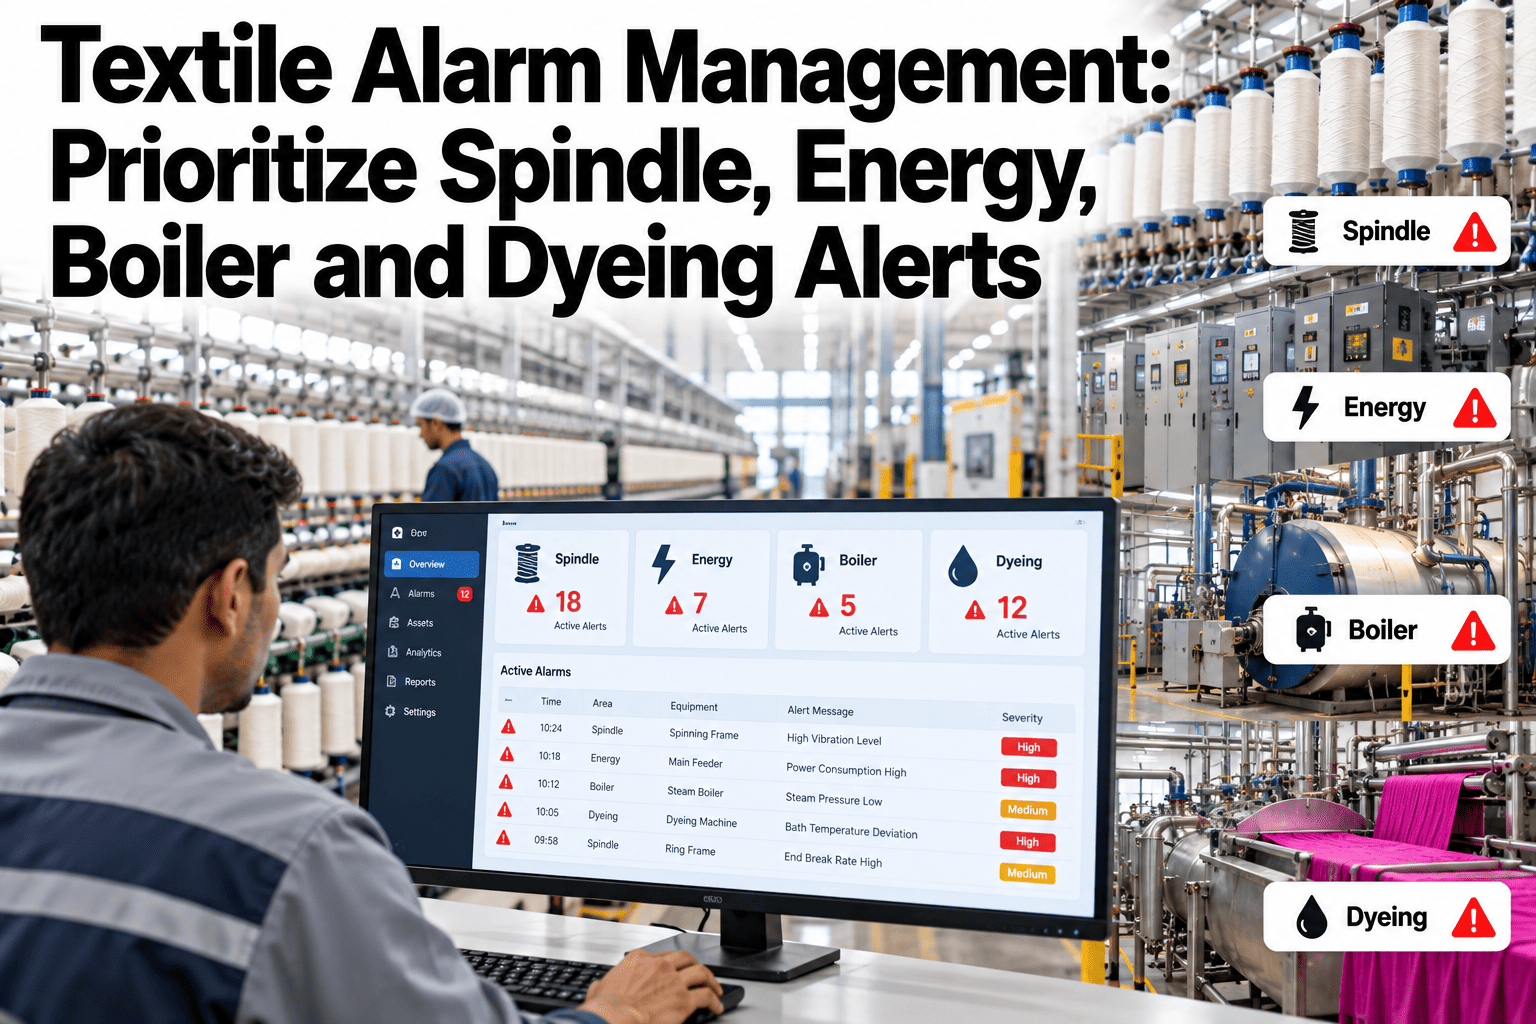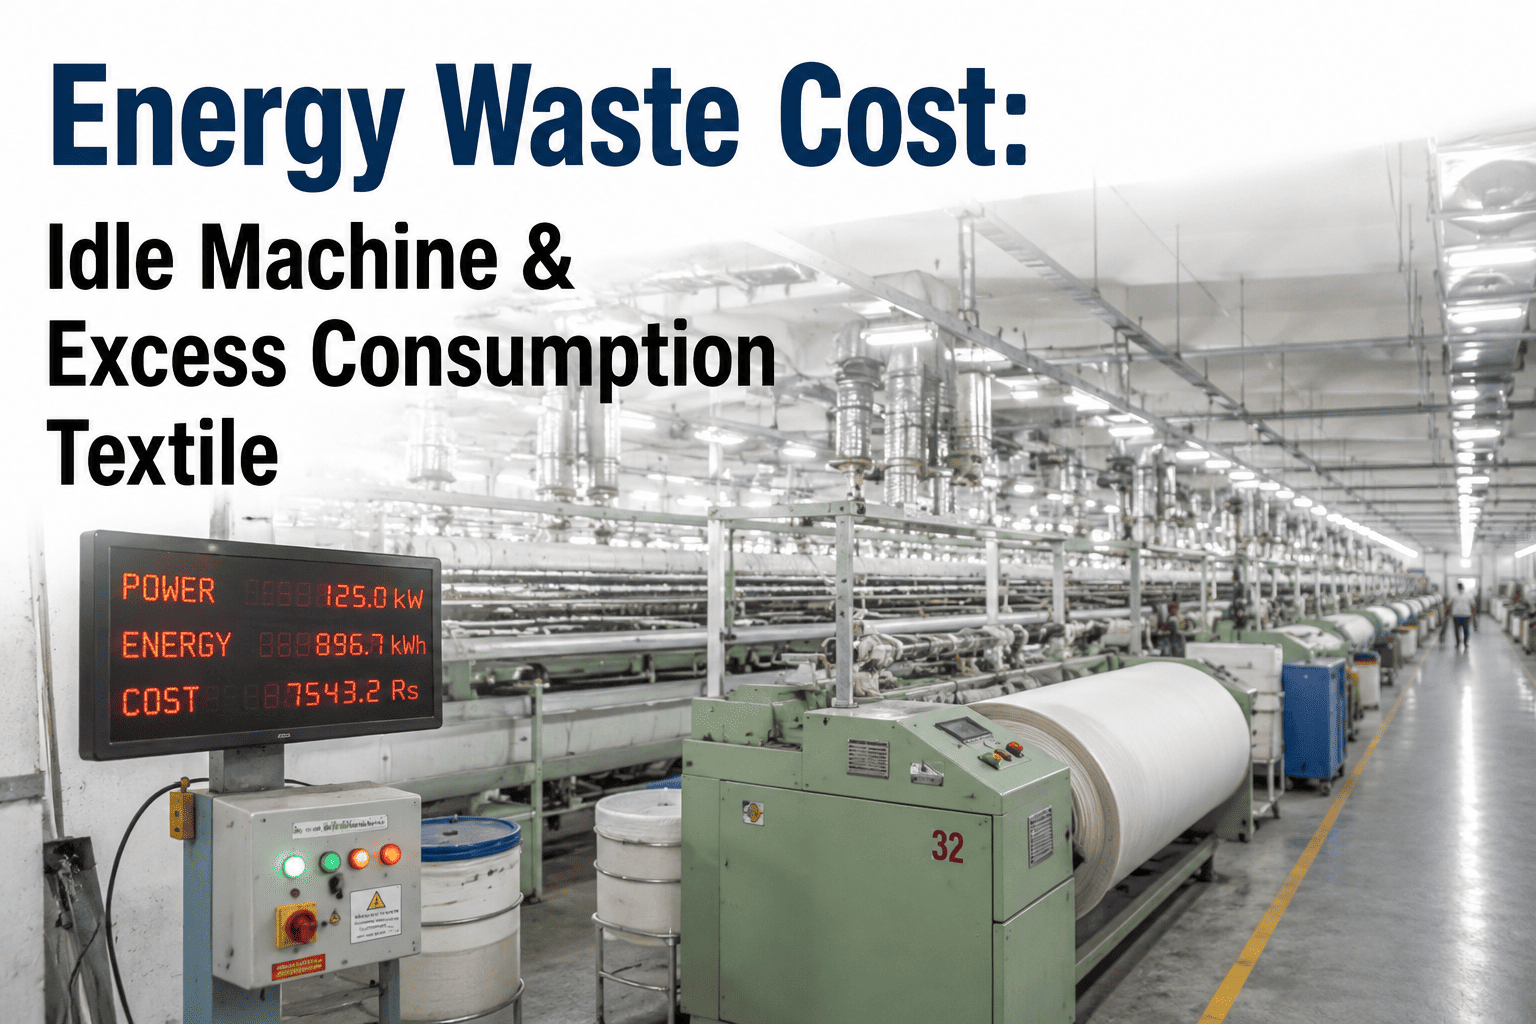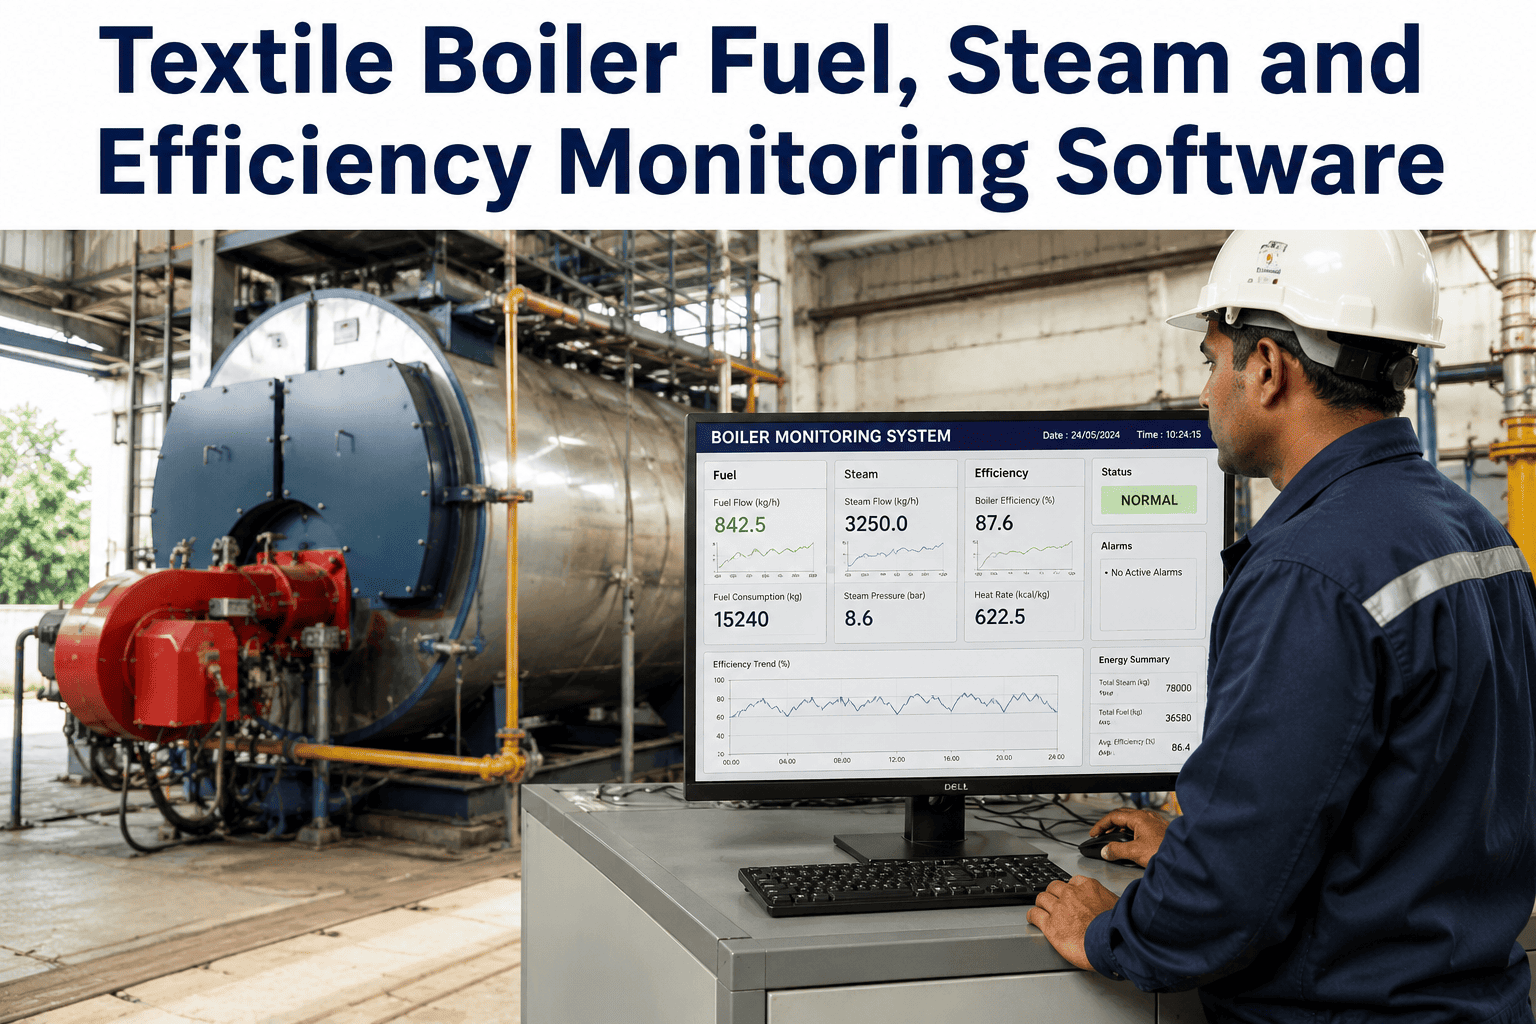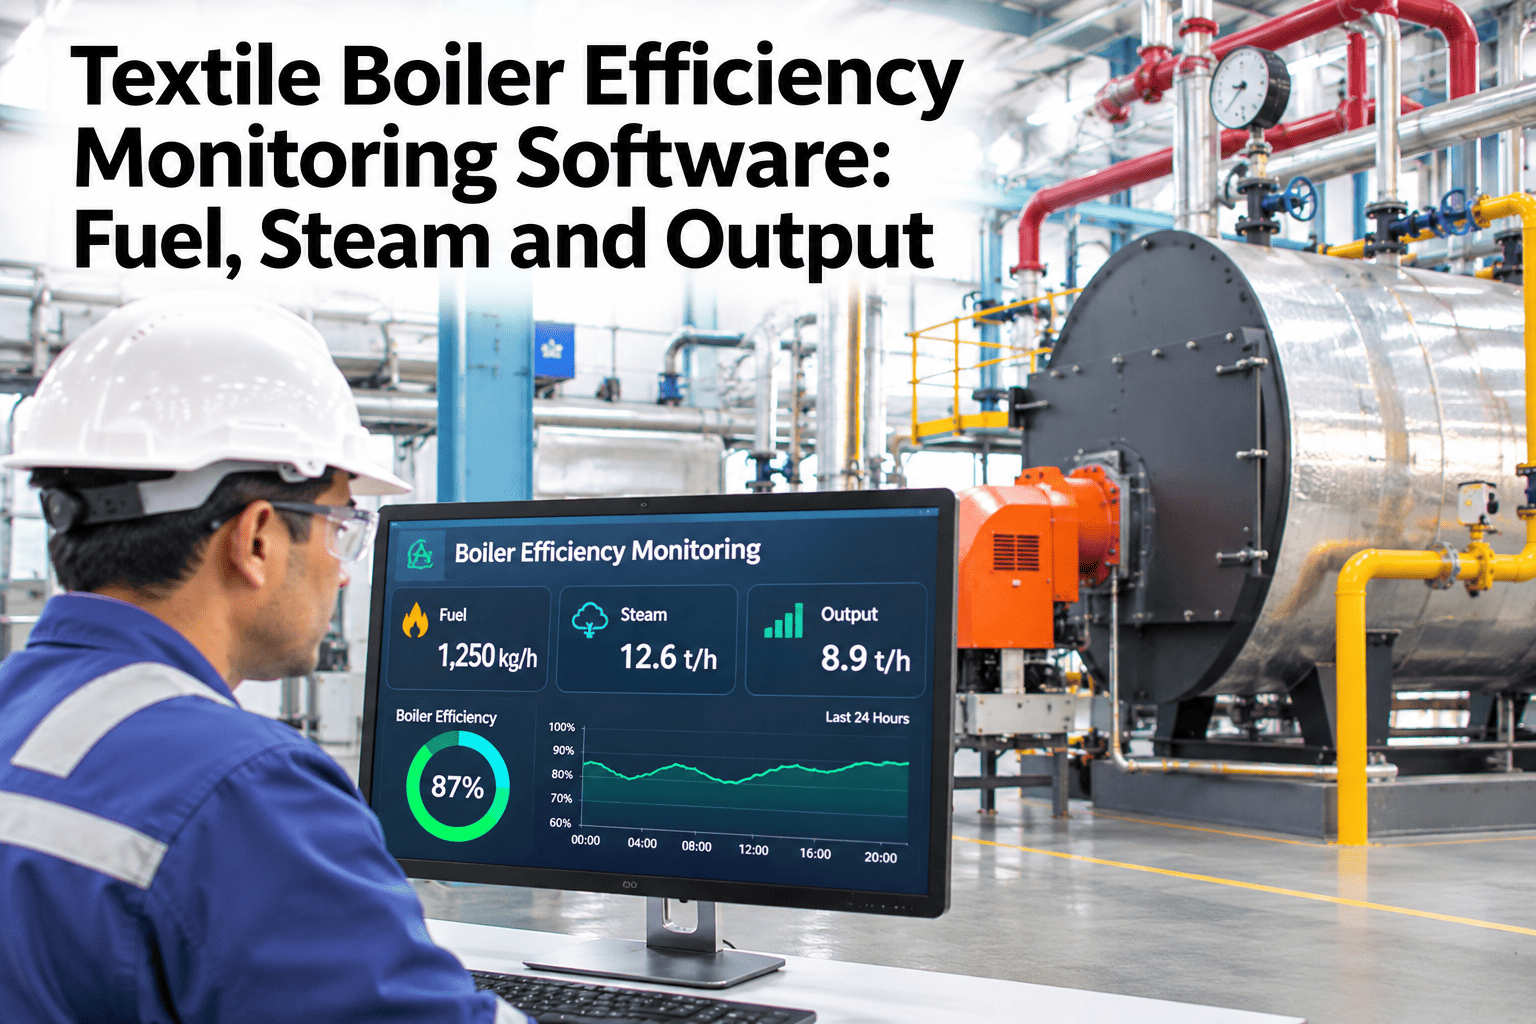
Textile boiler efficiency monitoring software tracks the fuel a boiler burns, the steam it raises and the fabric that steam finally produces, so you see steam cost per tonne and steam per kilogram of fabric in one view. It matters because a boiler house hides losses at three points: the stack, the steam network and the condensate return. A monthly fuel invoice shows none of them, and audits of wet processing plants report typical boiler efficiency well below target. iFactory, an on-premise industrial AI platform, links those readings to production output. See it on real boiler tags in a live demo.
Textile Boiler Efficiency Monitoring Software: Fuel, Steam and Output
Follow every unit of fuel from the burner to the fabric. See where combustion, distribution and condensate losses push your steam cost up.
What does boiler efficiency monitoring software measure in a textile mill?
It joins four data chains: fuel in, steam out, feedwater and condensate back, and fabric produced. From them it calculates boiler efficiency, steam cost and steam per kilogram of fabric every hour instead of once a year. Published figures show why that matters, and this walkthrough applies them to your boiler house.
Which four data chains does a boiler dashboard need?
Each chain answers a different cost question, and a gap in any one hides a loss.
Fuel in
Gas, coal or oil flow plus calorific value. It sets the cost side of every ratio.
Steam out
Flow, pressure and temperature at the header. Sets steam raised per hour.
Feedwater and condensate
Feedwater temperature, return flow and blowdown. Shows recovered heat.
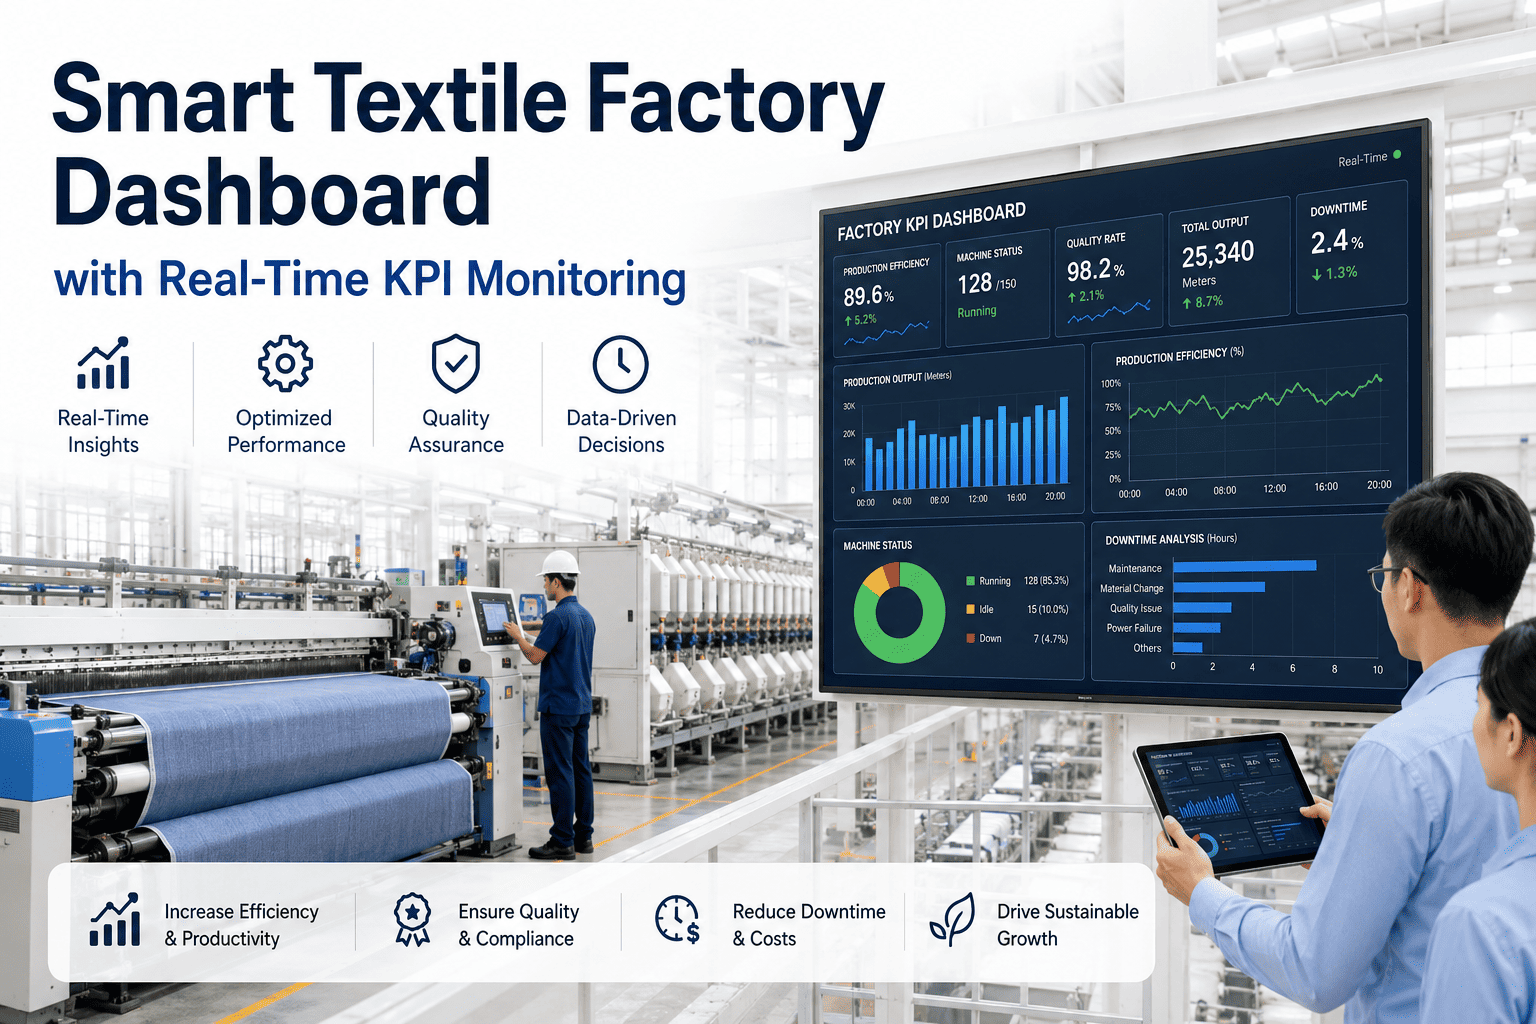
Fabric output
Kilograms or metres per machine and shift. Turns steam into a unit cost.
How do you calculate boiler efficiency and steam cost?
Two methods exist, and software should run both. The direct method divides heat in steam by fuel energy. The DOE steam tip sheet shows the heat output calculation as flow times the enthalpy difference between steam and feedwater. The support desk can share a worked sheet.
How much do stack temperature and excess air cost?
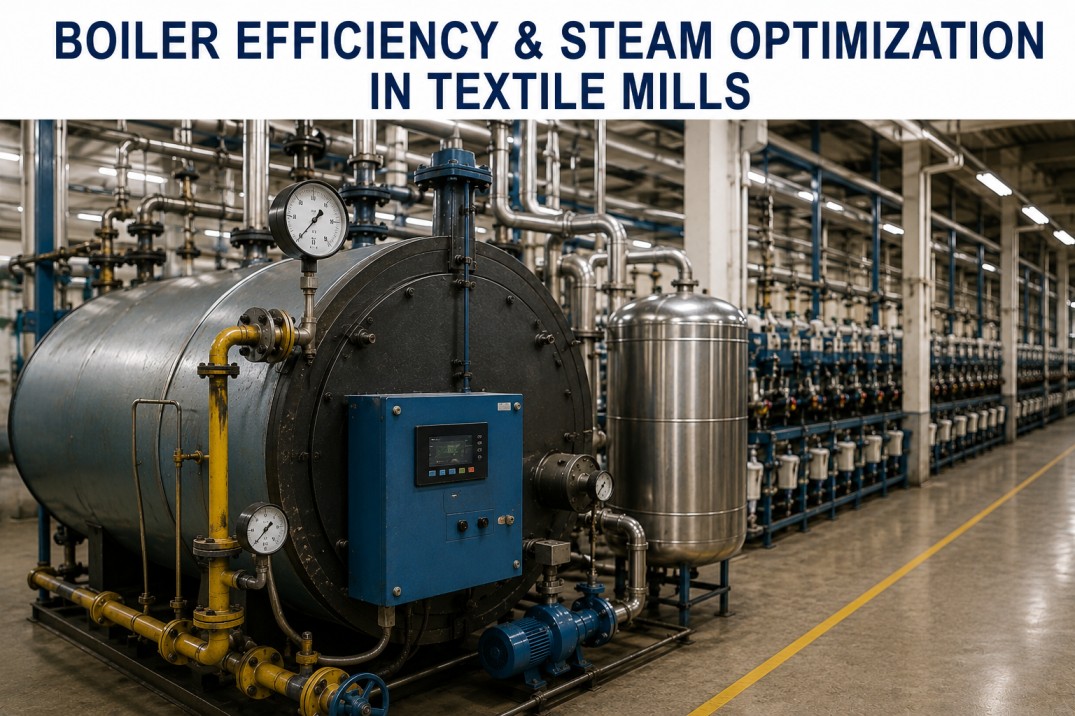
Combustion is the first loss to watch because the readings are simple. For natural gas at 15% excess air (3% oxygen), DOE combustion efficiency falls as flue gas runs hotter than the combustion air. Hotter stack, lower efficiency.
The same DOE sheet shows a worked case where tuning excess air and stack temperature lifted combustion efficiency from 78.2% to 83.1%. A stack running 100–150°F above steam saturation temperature points to scale or soot, so clean before tuning (Rasmech). Seasonal air changes can swing excess air 5–10% (Clayton Industries), which is why a demo session trends it live.
Where do distribution and condensate losses hide?
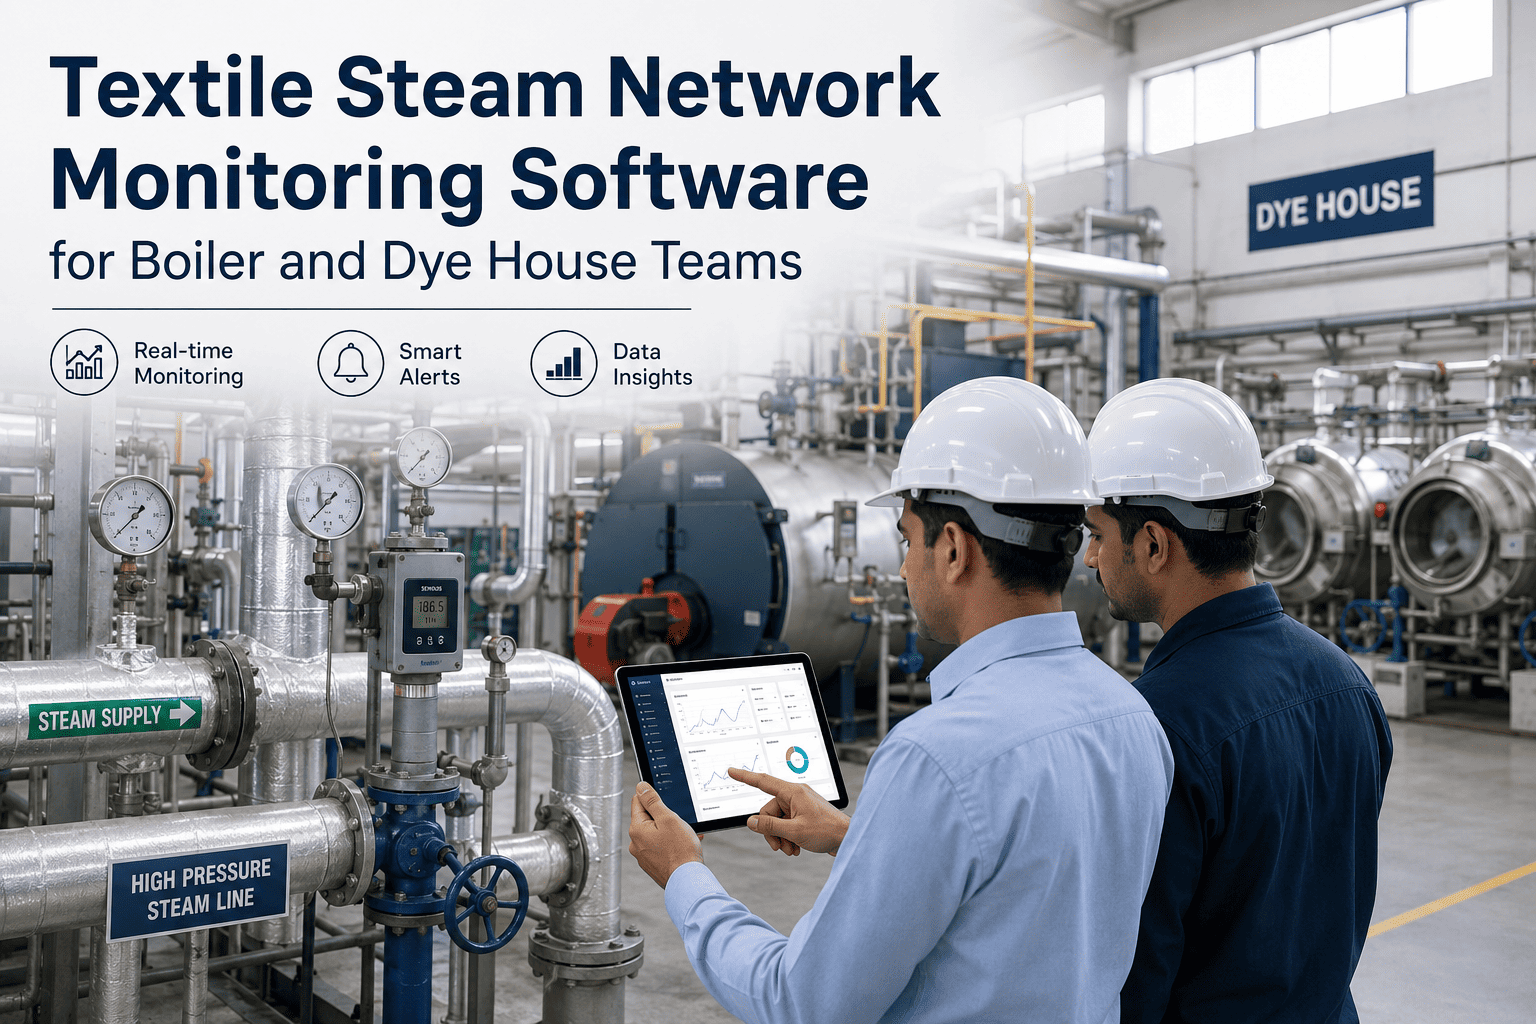
After the boiler, steam leaks heat through failed traps, bare pipe and condensate sent to drain. Each leaves a signal in pressure, flow and return temperature data.
These are fuel-bill reductions reported by a steam-equipment vendor for individual mills, so use them as direction, not a promise.
What does a tonne of your steam really cost?
Bring a week of fuel and steam data. iFactory shows efficiency, steam cost and steam per kilogram of fabric for each boiler.
Which KPIs should a textile boiler dashboard alert on?
No universal steam-per-kilogram target fits every process, so alert against your own baseline first. The grid below gives starting signals.
Should you fix operating losses or buy an economizer first?
Measure first, then spend. A feedwater economizer cuts fuel 5% to 10% and can pay back in under two years (U.S. DOE), but its value depends on a stack temperature worth recovering.
Fix operating losses first
Tune excess air, clean heat surfaces, repair traps, raise condensate return. Low capital, and it shows what recovery hardware would actually capture.
Add recovery hardware next
Economizers, blowdown heat recovery and flash steam units. Size them on the tuned boiler, using measured stack and blowdown data.
How do you roll out boiler monitoring in four steps?
Meter fuel and steam
Confirm fuel, steam and feedwater signals on every boiler.
Baseline four weeks
Record efficiency, stack readings, condensate return and steam per kg.
Rank the losses
Size combustion, distribution and condensate losses in fuel cost.
Fix and re-measure
Act on the top loss, then confirm the saving against baseline.
How does iFactory deliver boiler monitoring on-premise?
iFactory ships a pre-configured NVIDIA AI server, racked and ready, with software pre-loaded. Rack it, plug in power and Ethernet, and the AI is live. Scope covers cabling, network, PLC and SCADA integration, operator training and 24×7 remote monitoring. Ask for a pilot call to size yours.
Ship, network, data
Server arrives; fuel, steam and condensate tags connect.
Train and pilot
Efficiency and steam cost validated on one boiler.
Go live and train
All boilers, alerts and operator training.
Frequently asked questions
What is textile boiler efficiency monitoring software?
It is software that reads fuel flow, steam flow, feedwater, flue gas and condensate data, then calculates boiler efficiency, steam cost and steam per kilogram of fabric continuously. It flags drifting combustion, trap and distribution losses early. Book a walkthrough to see it on live boiler tags.
How do I calculate boiler efficiency from fuel and steam data?
Use the direct method: steam flow times the enthalpy gained from feedwater to steam, divided by fuel energy input. Cross-check with flue gas stack temperature and oxygen. iFactory automates both, and a short scoping call confirms which meters you already have.
What boiler loss should a textile mill check first?
Start with stack temperature, excess air and condensate return, because they are measurable today and drive most fuel waste. DOE rules of thumb tie each 40°F stack reduction to about 1% efficiency. Request a baseline or ask the support desk about sensors.
Do I need new meters to monitor boiler efficiency?
Often not. iFactory reads existing fuel meters, steam flow transmitters, PLC and SCADA tags, and adds sensors only where a stream is unmetered. A demo session maps coverage by boiler, and engineers on the support team can advise on placement.
How long does iFactory take to go live on a textile boiler house?
A typical turnkey rollout takes 6 to 12 weeks: ship and network, train and pilot, then go live with operator training. The server arrives pre-configured and ready to rack. Plan your pilot or ask the team about your site.
Turn boiler data into a steam cost you can manage
Get a turnkey on-premise setup that tracks fuel, steam and output per boiler, live in 6 to 12 weeks.