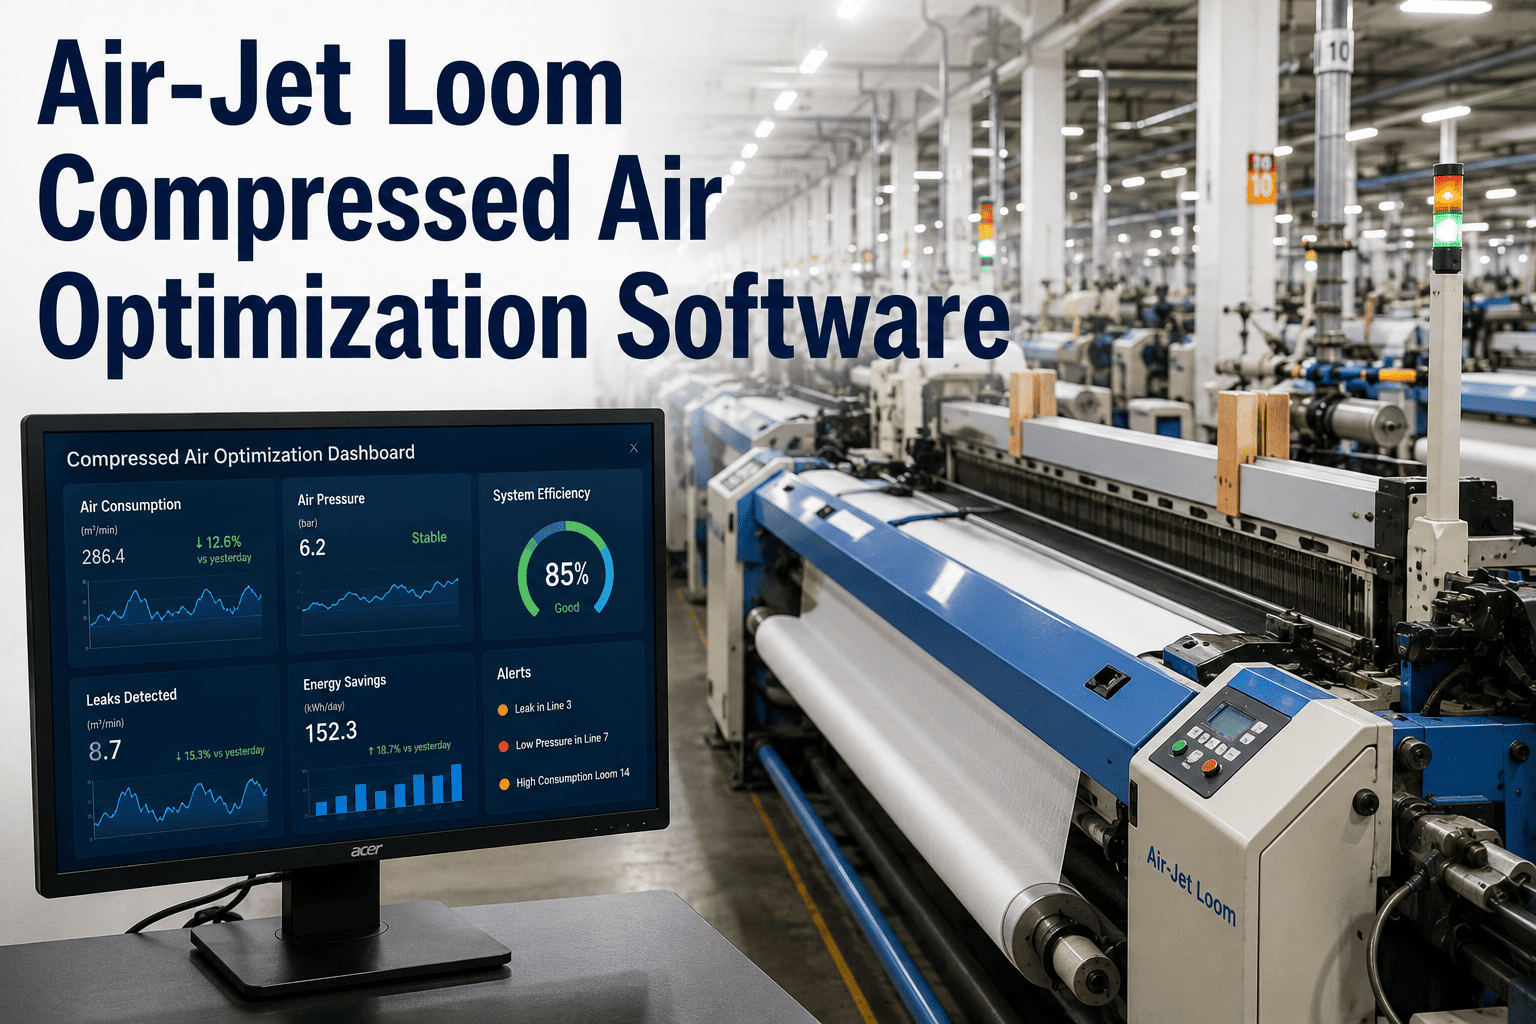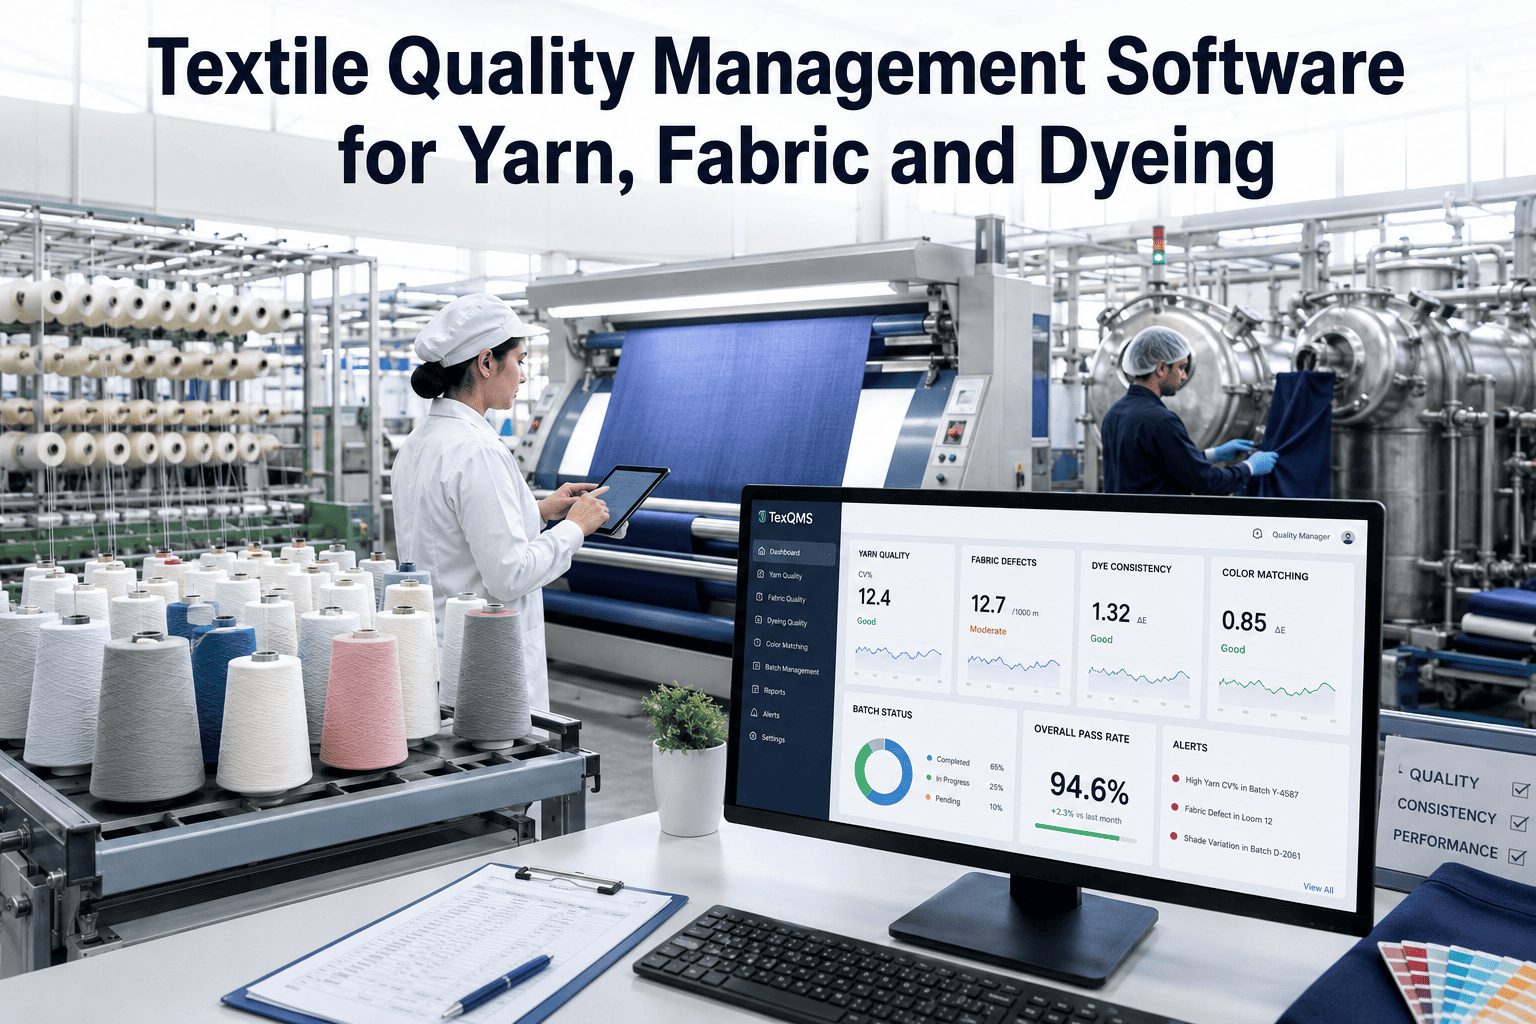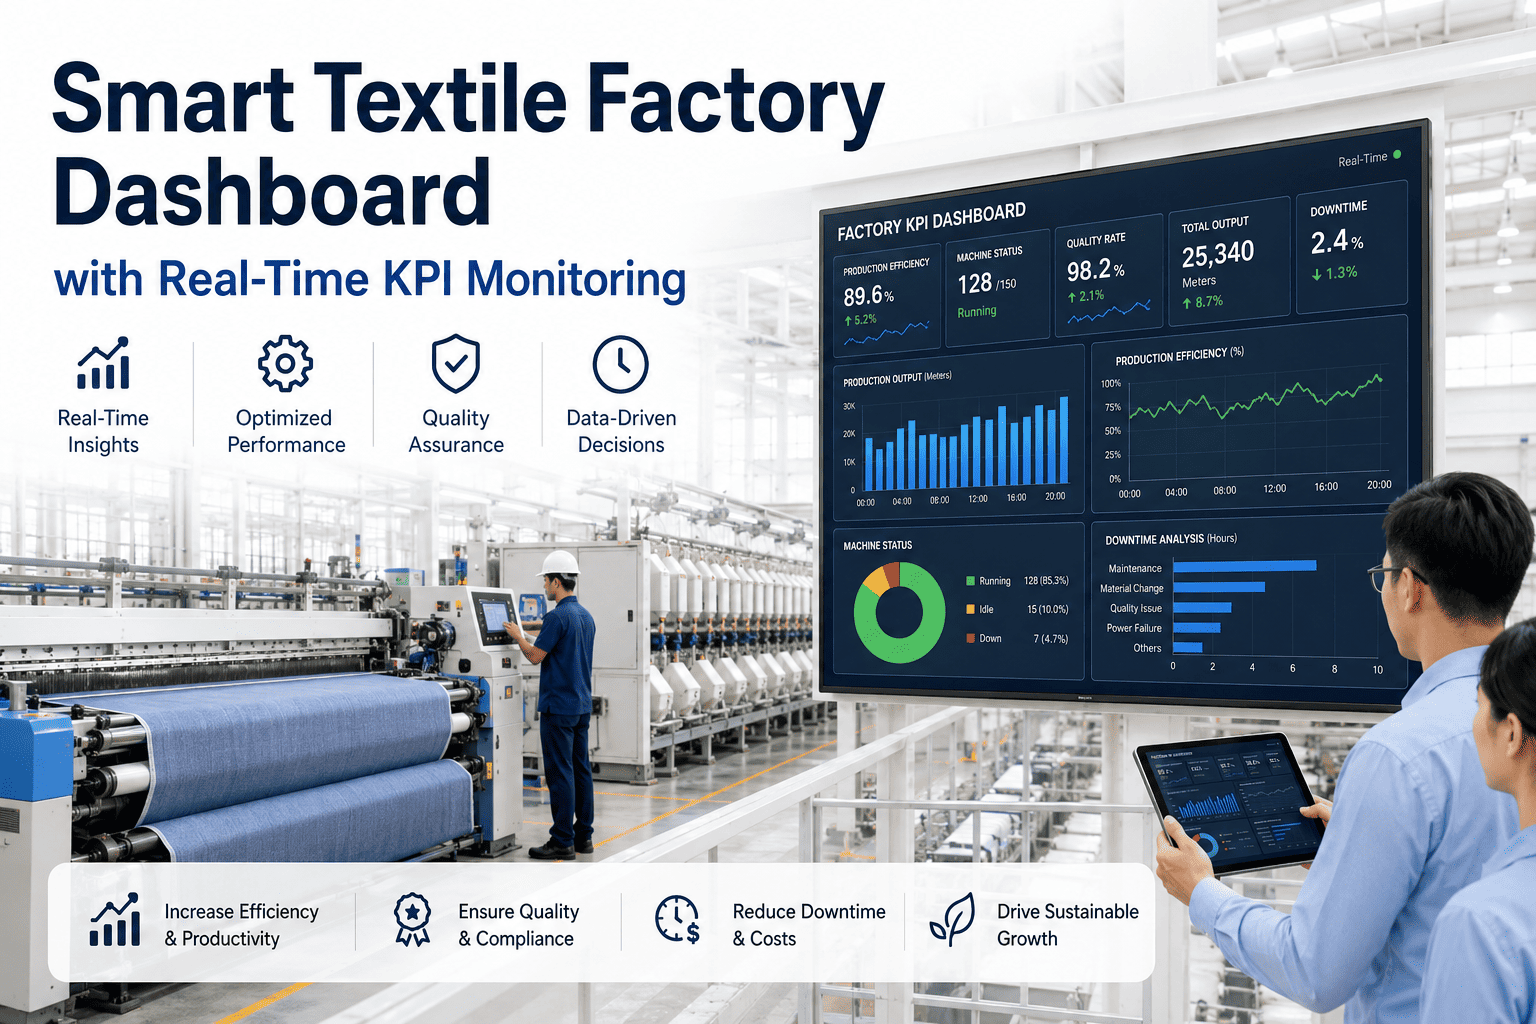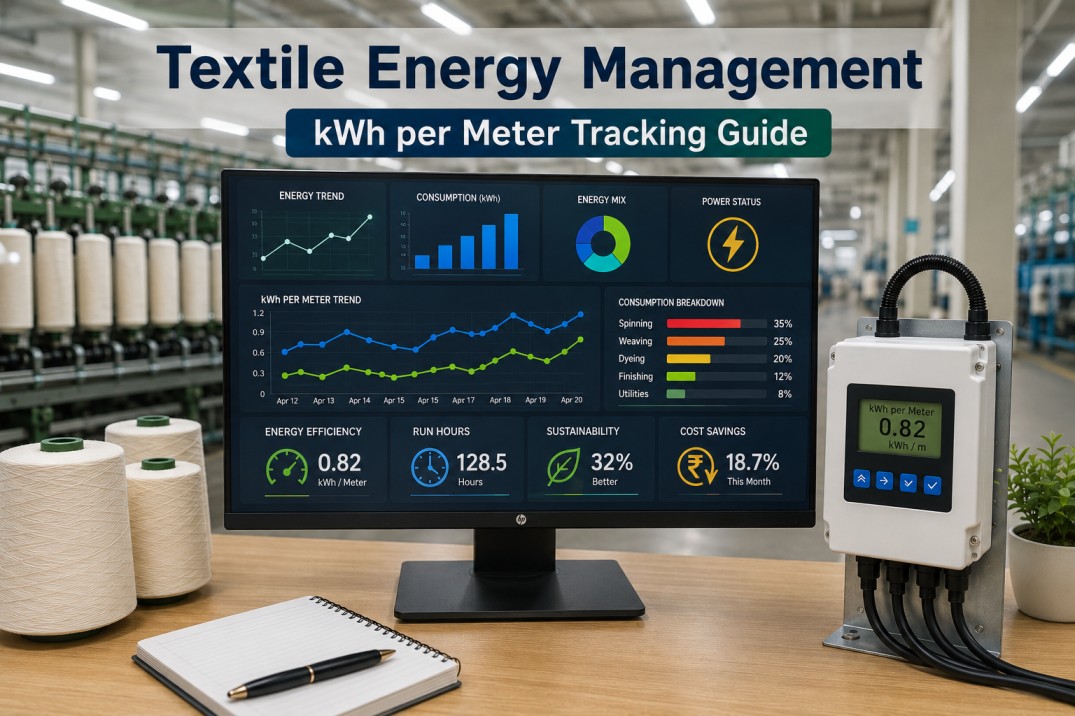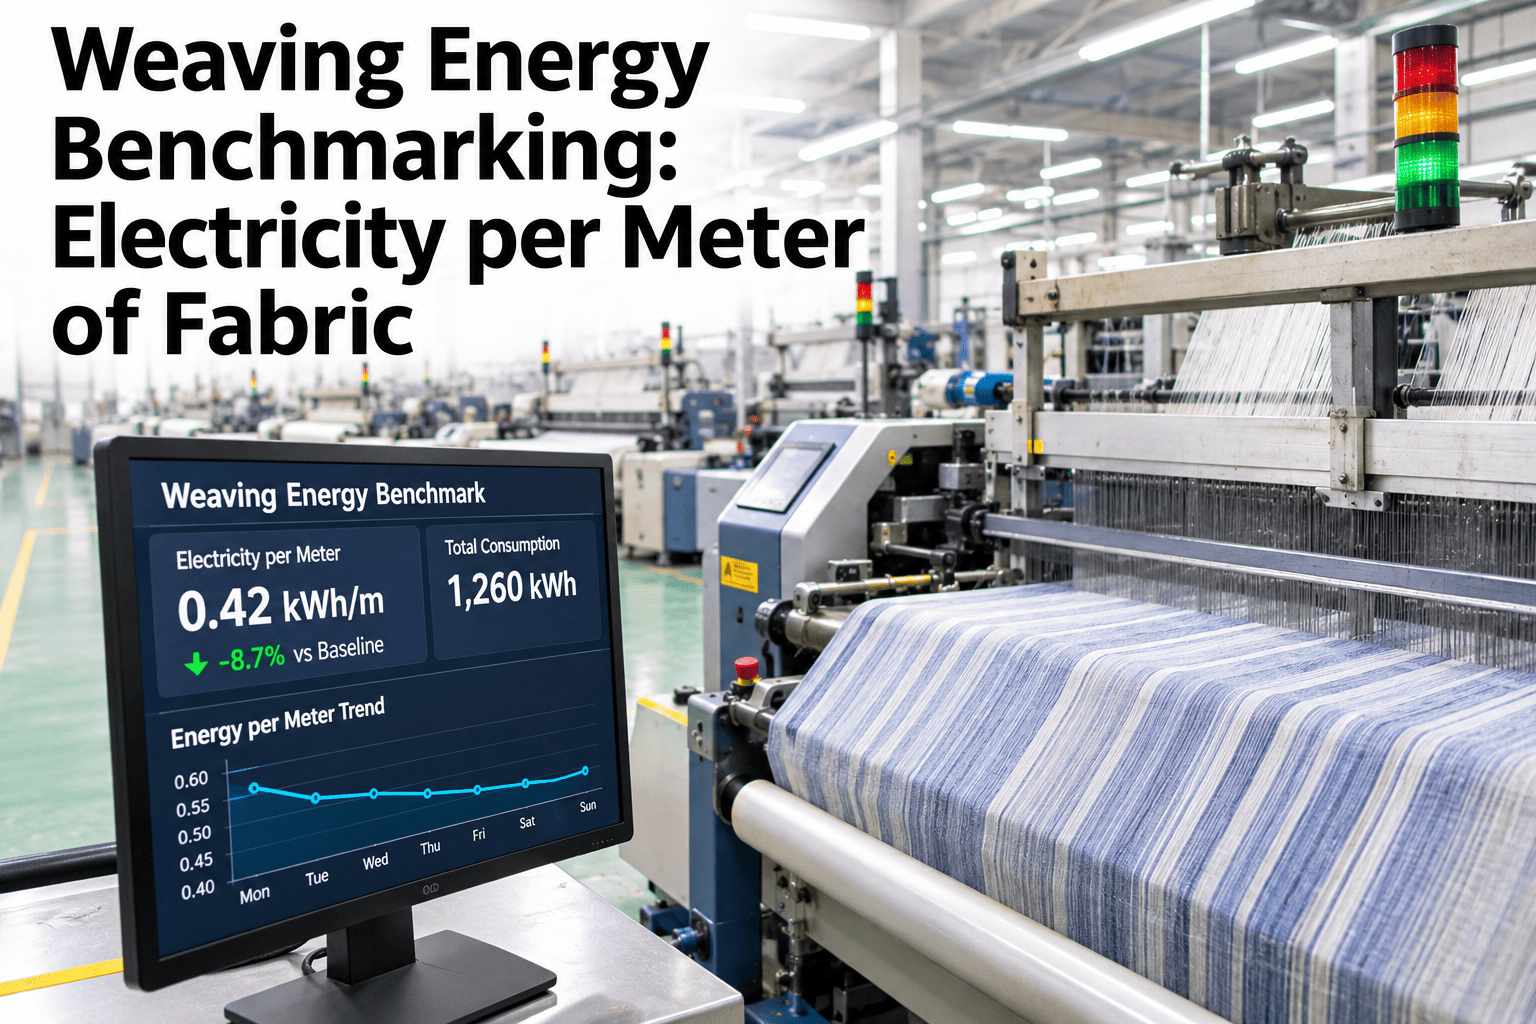
A mill-wide kWh-per-meter average tells you almost nothing about which loom is wasting energy — it just averages the good ones and the bad ones into a number nobody can act on. iFactory, an on-premise AI platform for textile energy management, benchmarks every loom against its own peer group — same type, same speed tier — so an outlier shows up as a specific loom, not a shrug-worthy mill average. See your looms benchmarked by peer group.
Compare Looms To Their Peers, Not To The Mill Average
An air-jet loom running hot looks normal next to a mill-wide average. It looks exactly like what it is next to other air-jet looms running the same speed and style.
One kWh/Meter Number Can't Tell Air-Jet From Rapier
A 48-loom shed running a mix of loom types produces one blended number that no single loom's performance can be checked against.
- Air-jet looms → run 30-40% higher energy per meter than rapier looms on comparable fabric, by design, not by fault.
- Blended into one mill average → a genuinely underperforming air-jet loom looks "about average" next to the rapier looms dragging the number down.
Peer-group benchmarking fixes this by comparing each loom only against others of its own type and speed tier — the only comparison that actually isolates a real problem from a design difference.
Same Type, Same Speed Tier, Same Comparison Pool
| Loom type | Typical range | Primary energy driver |
|---|---|---|
| Air-jet, high speed | 45-65 kWh / 1,000m | Compressed air generation, 70-80% of load |
| Rapier | 28-40 kWh / 1,000m | Mechanical drive, motor load |
| Projectile | 32-45 kWh / 1,000m | Mechanical drive plus wider reed width |
A loom more than 15% above its own peer-group median is the signal worth chasing — not a loom that's simply a different, naturally higher-consuming type than the shed average.
Running A Mixed Loom Shed On One Average?
Send your loom inventory by type and speed — the team will show what a peer-grouped benchmark would surface that a mill-wide average currently hides.
15% Above Peer Median Is a Starting Point, Not a Verdict
The flag tells you which loom to look at. It doesn't tell you why, and the three most common reasons point to three different fixes.
- Air leakage → nozzle or fitting wear, invisible without flow data, fixable in hours once located.
- Mechanical drag → bearing wear or misalignment raising motor load above its peers.
- Timing drift → insertion timing out of spec, forcing extra air or drive effort to compensate.
The Loom Wasn't Broken. It Was Just Being Compared Wrong.
A 60-loom shed running a mix of 36 air-jet and 24 rapier looms shows a mill-wide average of 42 kWh per 1,000 meters — comfortably inside what the plant manager considers normal. One specific air-jet loom is actually running at 61 kWh per 1,000 meters, nearly 35% above its own air-jet peer group's median of 46. Against the blended mill average, it barely registers as high. Against its actual peers, it's an obvious outlier that turns out to be losing air through a worn nozzle fitting — a two-hour fix once someone finally compared it to the right baseline instead of the shed's overall number.
Four Questions That Decide Whether Peer Grouping Actually Works
- Is loom type tagged at the data source? If energy readings aren't tagged air-jet, rapier, or projectile, there's no peer group to compare against.
- Is speed tier captured alongside type? Two air-jet looms running different speeds aren't true peers either — speed changes the energy baseline within a type.
- Is fabric style accounted for? A wider or denser fabric shifts the baseline regardless of loom type or speed.
- Is the threshold set per peer group, not mill-wide? A single "15% above average" rule applied mill-wide re-introduces the exact blending problem peer grouping was meant to fix.
Comparing This Month's Loom To Last Month's Isn't Peer Benchmarking
Tracking one loom's trend over time catches drift. It doesn't catch a loom that's been running high since installation and never had anything to compare against.
- Trend-only monitoring → a loom that's always run 20% hot looks flat and "normal" because it's never changed.
- Peer-group benchmarking → the same loom immediately stands out against five others of its own type running the same fabric at the same speed.
Both views matter, but only one of them catches a problem that was there from day one rather than a problem that developed recently. A benchmark built only on trend lines will miss exactly the outliers a peer comparison exists to find.
What a Few Flagged Looms Are Actually Worth
A handful of outlier looms running 15-20% above their peer group, corrected across a 6,000-hour operating year, adds up to a meaningful recovered cost before anyone considers a single piece of new equipment.
Every Loom Scored Against Its Own Type and Speed Tier
iFactory's energy platform tags every loom reading by type, speed tier, and fabric style at the data source, then benchmarks each loom only against its true peer group rather than the shed-wide average.
- kWh per 1,000 meters tracked per loom, per loom type, per speed tier.
- Outliers flagged at 15% above peer-group median, not mill average.
- Compressed air, motor load, and timing data fused to narrow down the likely cause once a loom is flagged.
- On-premise deployment — loom-level energy data stays inside the plant network.
What A Weaving Floor Manager Should Check First
A benchmark is useful the moment it can name a specific loom, not just a department-wide trend.
What Weaving Floor Teams Ask About Loom Energy Benchmarking
A shed-wide number blends naturally higher-consuming loom types with lower ones, hiding a genuine outlier inside an average that looks fine. See your shed broken out by loom type with the team.
It's a reasonable starting point, but the right threshold depends on how tight your peer group's natural variation already is — tighter groups can flag smaller deviations. Ask support how thresholds get tuned per mill.
Yes — a high-speed air-jet loom and a slower one from the same family have different energy baselines, so grouping by type alone can still mask an outlier. Walk through speed-tiered grouping on your own data.
Fusing compressed air flow data with motor load and timing data narrows it down before anyone has to physically inspect the machine. See how cause narrowing works with the team.
Yes — loom-level tagging and peer-group benchmarking typically layer onto existing meters and sensors rather than requiring new hardware. Ask about your current metering setup.
Benchmark Your Loom Shed By Type And Speed Tier
Book a session with the iFactory team and see which specific looms are outliers once they're compared to the right baseline instead of a mill-wide average.