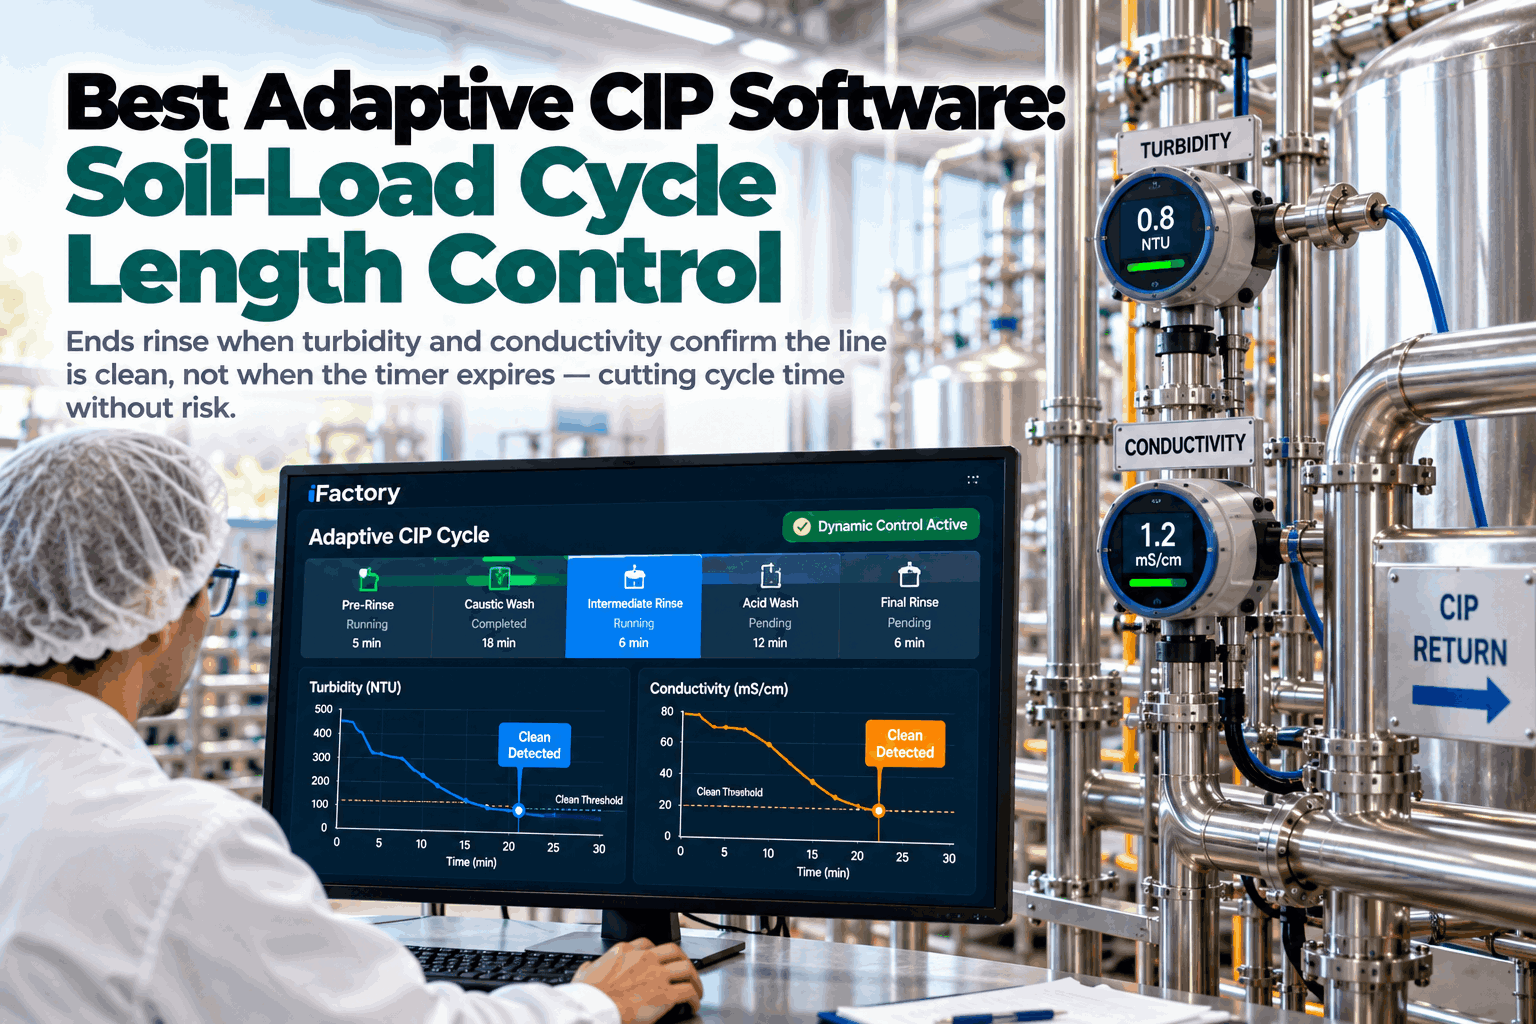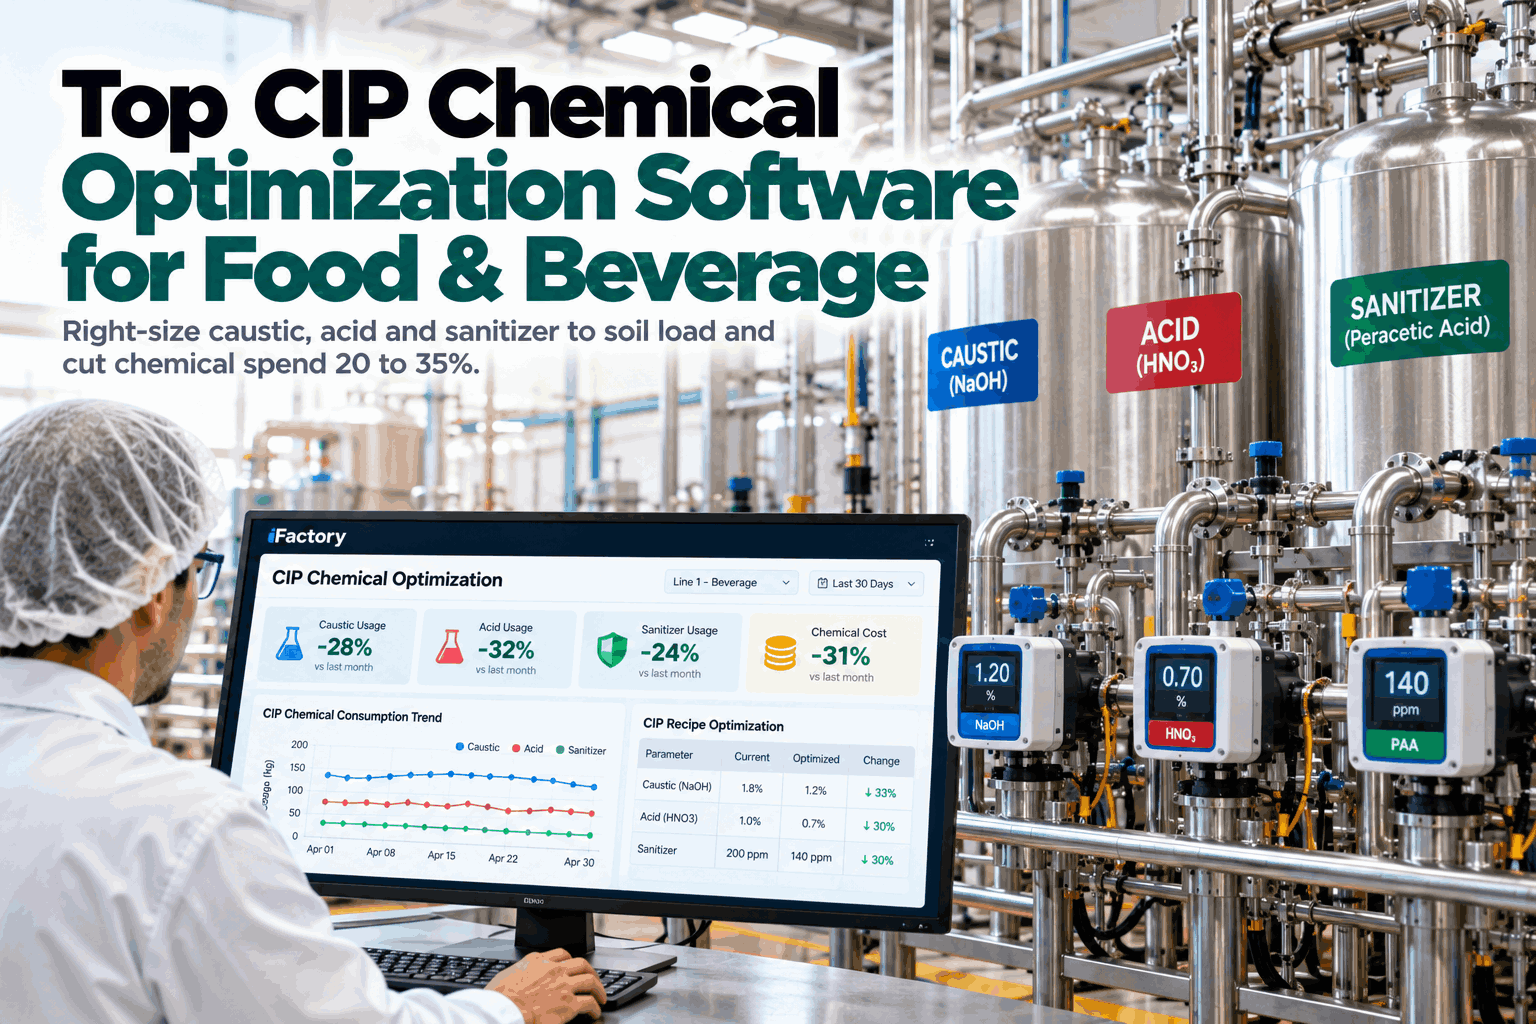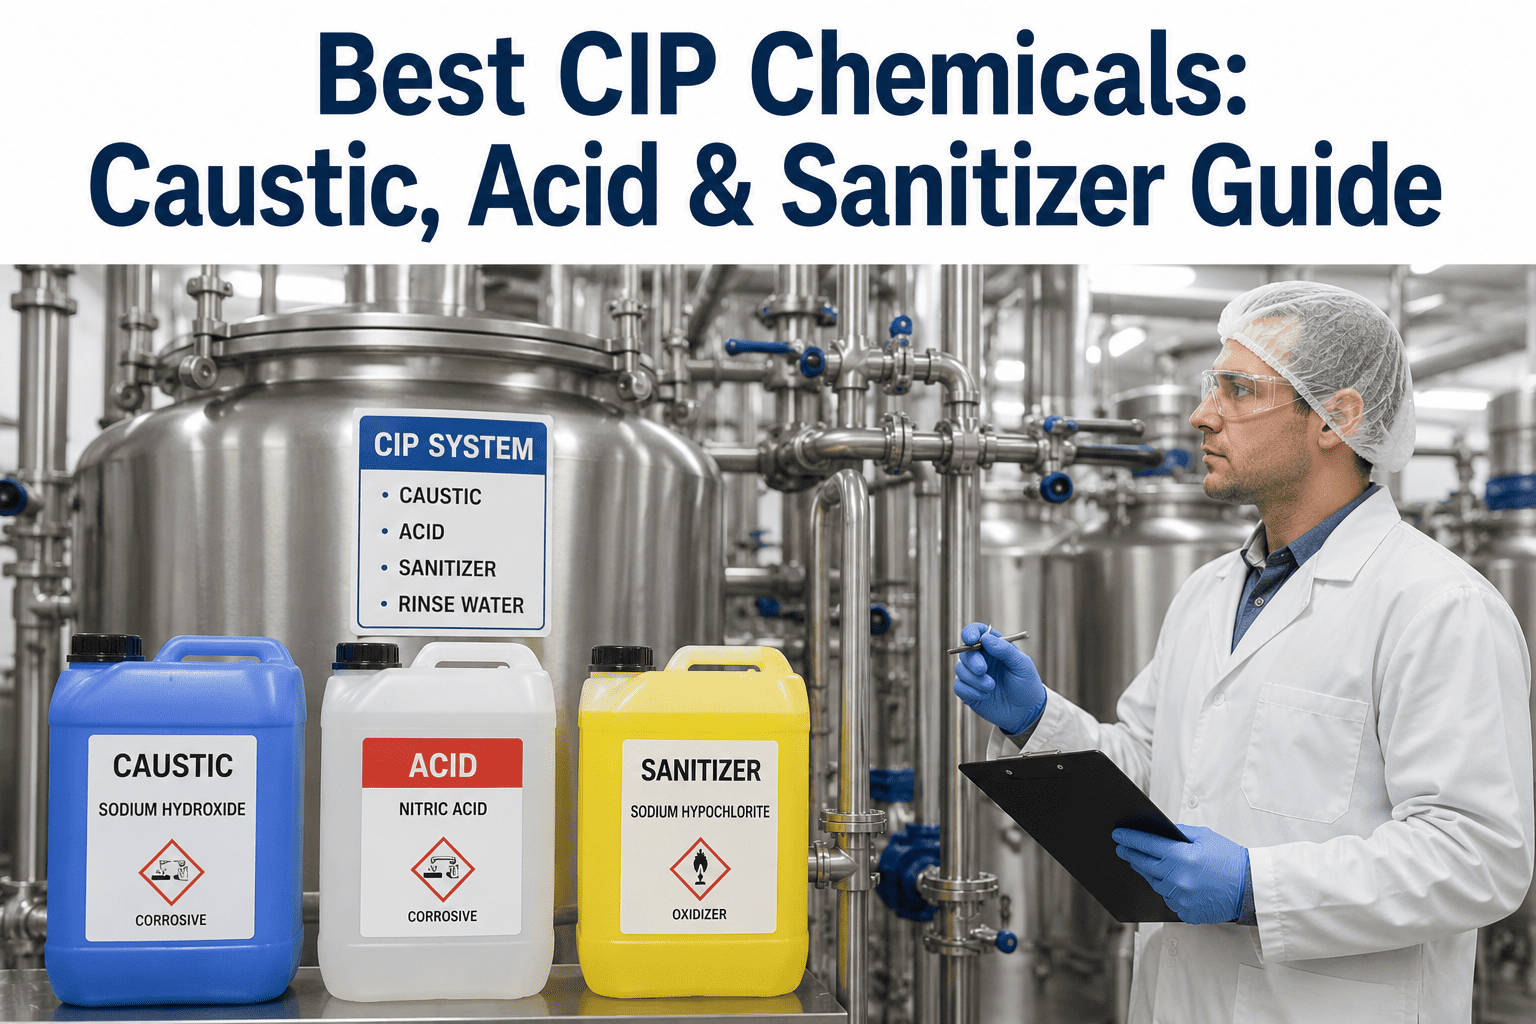
Caustic and acid concentration in a CIP system is usually set once, during commissioning, and then left alone for years out of caution rather than evidence. Soil load changes by shift, by product and by season, yet the dosing rarely changes with it, which means most plants are paying to overclean most of the time just to stay safe on the worst day. Chemical optimization software closes that gap by dosing to the soil actually present in the line, and plants exploring this usually start by reviewing a month of their own chemical usage data before changing a single setpoint.
You Are Likely Overdosing Caustic and Acid Right Now
iFactory AI reads conductivity, flow and soil signals through every CIP cycle and adjusts chemical dosing in real time, so concentration matches what the line actually needs instead of a fixed safety margin.
Why Plants Overdose Chemistry Without Realizing It
Dosing is usually set to handle the heaviest soil load the line ever sees, then left there permanently. That single conservative setpoint becomes the standard for every cycle, even the ones running far cleaner product with much lighter residue.
None of these habits are unreasonable on their own, but stacked together they quietly turn a safety margin into a permanent, invisible cost.
Where Chemistry Is Spent Across a CIP Cycle
A standard CIP cycle moves through five phases, and chemical cost concentrates in just two of them. Seeing the phases laid out makes it clear where optimization has the most room to work.
The caustic and acid wash phases carry almost all of the chemical cost, which is exactly where conductivity-based dosing control has the biggest effect on the monthly bill.
The Three Levers Behind Every Chemical Spend Number
Chemical cost is not one setting, it is three separate decisions that each move the total independently, and most plants only ever manage the first one.
Software that only reports usage addresses none of these levers. Optimization requires acting on all three together, cycle by cycle.
See Which Lever Is Costing You the Most
Share a recent month of chemical usage and get a breakdown of how much is tied to concentration, reuse and recipe selection.
One Line's Caustic Spend, Before and After Dosing Control
Here is a simplified monthly comparison for a single pasteurizer CIP skid after conductivity-based dosing replaced a fixed setpoint.
| Metric | Fixed setpoint | Optimized dosing | Change |
|---|---|---|---|
| Caustic used per month | 1,840 L | 1,320 L | -28% |
| Acid used per month | 960 L | 710 L | -26% |
| Average cycle time | 52 min | 46 min | -12% |
| Failed swab tests | 3 per month | 1 per month | Lower |
Cycle time dropped alongside chemical use in this example, since cycles no longer ran a full fixed duration once conductivity confirmed the target was already reached.
Closed-Loop Dosing, One Cycle at a Time
Optimization software does not replace the CIP skid, it sits on top of it and adjusts dosing decisions using live signals from the same cycle that is currently running.
Signs Your Plant Is Overdosing Right Now
A few recurring symptoms on the floor usually point to chemistry that has drifted away from what the soil load actually requires.
Any one of these alone is not conclusive, but two or more together are a strong signal that a chemistry review is overdue.
Where Overdosing Tends to Be Worst
Not every chemical drifts the same amount. The table below shows typical overdose ranges reported by plants before a review, as a starting reference point.
| Chemical | Common use | Typical overdose range |
|---|---|---|
| Caustic soda | Primary soil removal wash | 15% to 30% |
| Nitric or phosphoric acid | Mineral scale and protein removal | 10% to 25% |
| Sanitizer | Final microbial kill step | 5% to 20% |
These ranges vary by water hardness, soil type and recipe age, so they are a starting reference rather than a number to assume for your own plant. Check your own range against a short usage review.
Get Your Plant's Chemical Optimization Estimate
Book a session with iFactory AI and see how much caustic, acid and sanitizer spend is tied up in outdated fixed dosing.
A Short Readiness Checklist
A focused pilot on one CIP skid is easier to measure and defend than a plant-wide change on day one.