Best AI Loss Attribution Software for Food Manufacturing

By James Smith on November 13, 2026

best-ai-loss-attribution-software-for-food-manufacturing

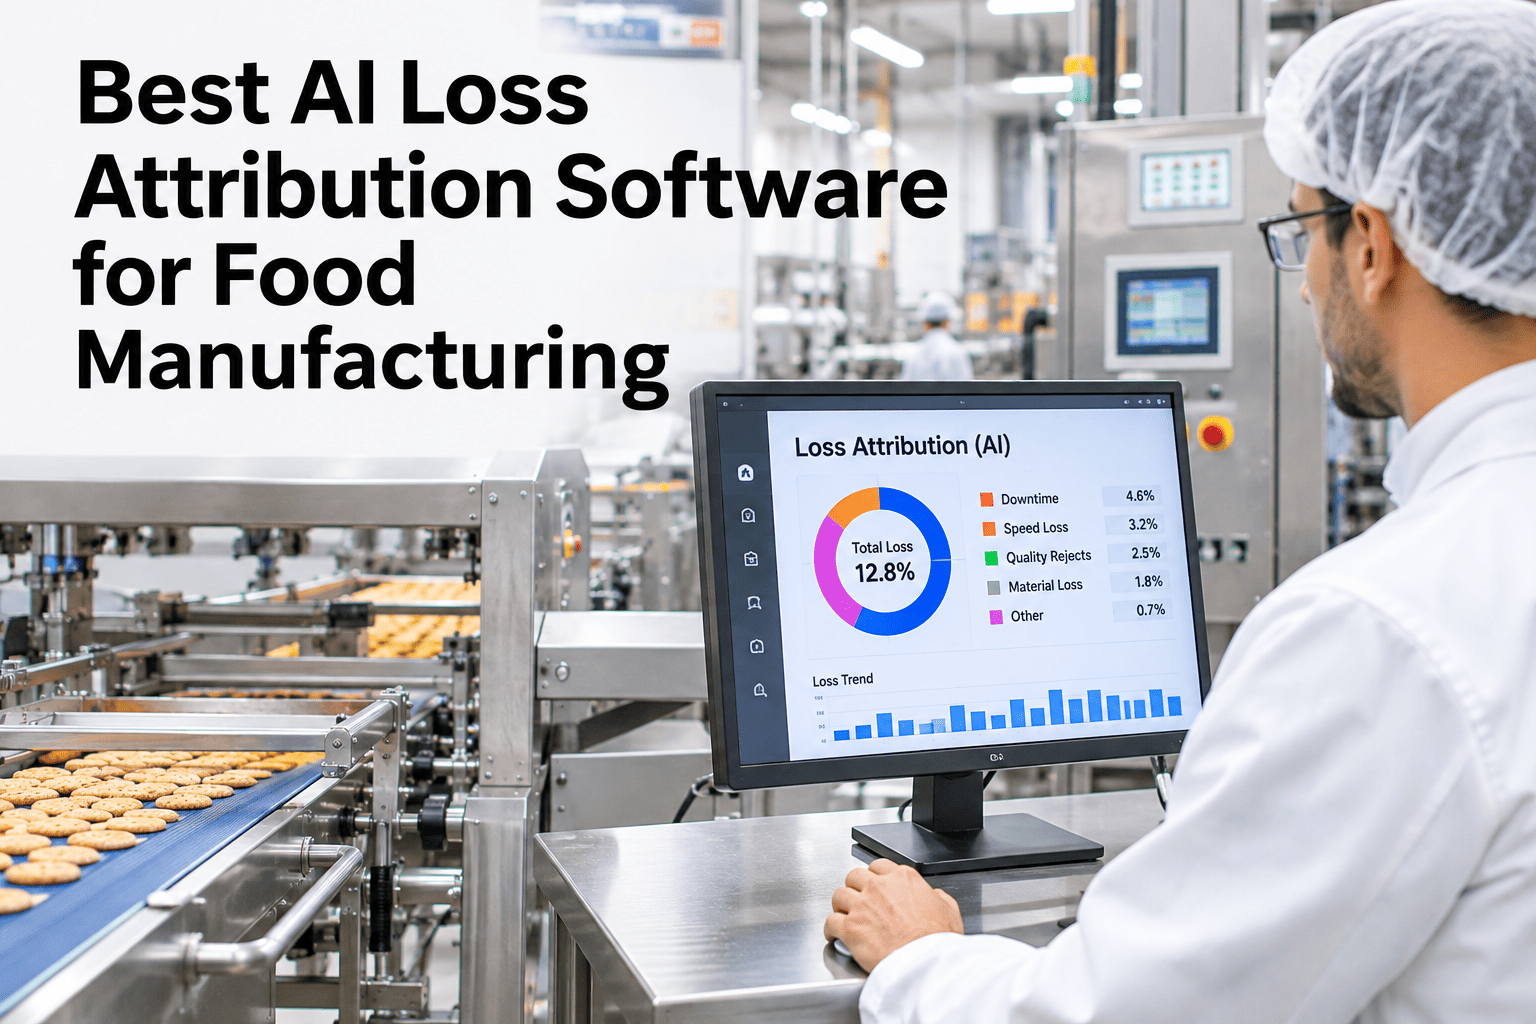
Knowing that a line lost 40 minutes to availability, performance and quality losses last shift is not the same as knowing it cost $1,800, and it is the dollar figure that actually gets capital allocated to fix it. Loss attribution software closes that specific gap: it ties every availability, performance and quality loss event to a named root cause and attaches a dollar value to it, so a plant director comparing ten possible fixes can rank them by what they are actually worth. You can see your own losses translated into dollar figures with our team.

Food Plant Loss Economics, 2027

Every Loss Event Gets a Cause and a Dollar Value

iFactory, an on-premise AI platform for production monitoring and OEE analytics, attributes every availability, performance and quality loss to a root cause and assigns it a dollar value, so loss data drives capital decisions instead of sitting in a report nobody prioritizes from.

Availability
$640
Performance
$890
Quality
$270
What it is

What Does Loss Attribution Actually Add to an OEE Report?

A standard OEE report shows a percentage and, at best, a time breakdown by loss category. Loss attribution software goes further on two dimensions: it links each loss event to a specific root cause — a named asset, reason code or upstream condition — and converts the lost time into a dollar figure based on that line's actual production value.

The dollar conversion is what changes behavior. A director can debate whether 40 minutes of downtime "matters" all day; nobody debates whether $1,800 matters, and ranking ten loss events by dollar value makes the prioritization decision almost automatic.
The calculation

How a Loss Event Becomes a Dollar Figure

Lost Time
times
Line Rate (units/min)
times
Unit Value or Margin
equals
Dollar Value of the Loss

Quality losses use a slightly different path, valuing scrapped or reworked product against its material and labor cost to that point in the process, rather than lost-time throughput alone.

What goes into it

Three Inputs Every Attribution Model Needs

Loss event data
Availability, performance and quality losses, reason-coded and timestamped.
Line economics
Production rate and unit value or margin specific to that line and product.
Root cause link
Each loss tied to a specific asset or condition, not just a generic category.

See Your Losses Ranked by Dollar Value

Share a week of loss event data from one line and see it ranked by actual dollar impact, not just time lost.

Book a Loss Attribution Review Ask About Unit Economics Setup
Comparison

Time-Based OEE Reporting vs Dollar-Attributed Loss Analysis

DimensionTime-Based OEEDollar-Attributed Loss
Unit of measureMinutes lostDollars lost
PrioritizationSubjective — which loss "feels" biggestObjective — ranked by actual dollar value
Capital justificationRequires translating time to cost manuallyDollar figure built in from the start
Cross-line comparisonHard — different lines, different ratesDirect — dollars compare across any line
Expert review

What a Plant Finance Partner Would Check First

Holds up
Converting operational loss into financial terms before prioritizing fixes is standard cost-of-poor-quality and reliability-economics practice, not new to this application.
Watch for
A dollar figure built on a stale or average unit value rather than the line's actual current product mix and margin — the number only holds up if the economics behind it are current.
Do next
Start with your highest-margin line first, since that is where a given loss event's dollar value is usually largest and the ranking has the clearest payoff.
FAQ

What Food Plants Ask About Loss Attribution

How is a loss event's dollar value actually calculated?
Lost time is multiplied by the line's production rate and the unit value or margin for the product running at the time; quality losses are valued separately against the material and labor cost already invested in the scrapped or reworked product. Walk through this calculation on your own line.
What if unit value or margin changes frequently by product mix?
The model should pull the specific product's value at the time of the loss event, not a line-wide average, since a plant running several SKUs on one line will see meaningfully different dollar values for the same amount of lost time. Ask how mixed-SKU lines are handled.
Does loss attribution replace a standard OEE calculation?
No — it builds on the same availability, performance and quality loss data an OEE calculation already uses, adding root cause and a dollar value on top rather than replacing the underlying measurement.
How does this help justify a capital request?
A request backed by "this specific asset cost us $42,000 in attributed losses last quarter" is a stronger capital case than a general downtime percentage, since it directly answers the return-on-investment question a capital committee will ask. Build a capital case from your own loss data.
Can losses be compared fairly across different lines with different products?
Yes — converting time to dollars is what makes cross-line comparison meaningful, since a line running a low-margin product and a line running a high-margin product cannot be fairly compared on lost minutes alone. Discuss cross-line comparison with our team.

Turn Your Loss Report Into a Capital Priority List

Book a session with iFactory AI to attribute your plant's losses to root cause and dollar value, line by line.

Book a Loss Attribution Demo Contact Our Support Team
Share This Story, Choose Your Platform!