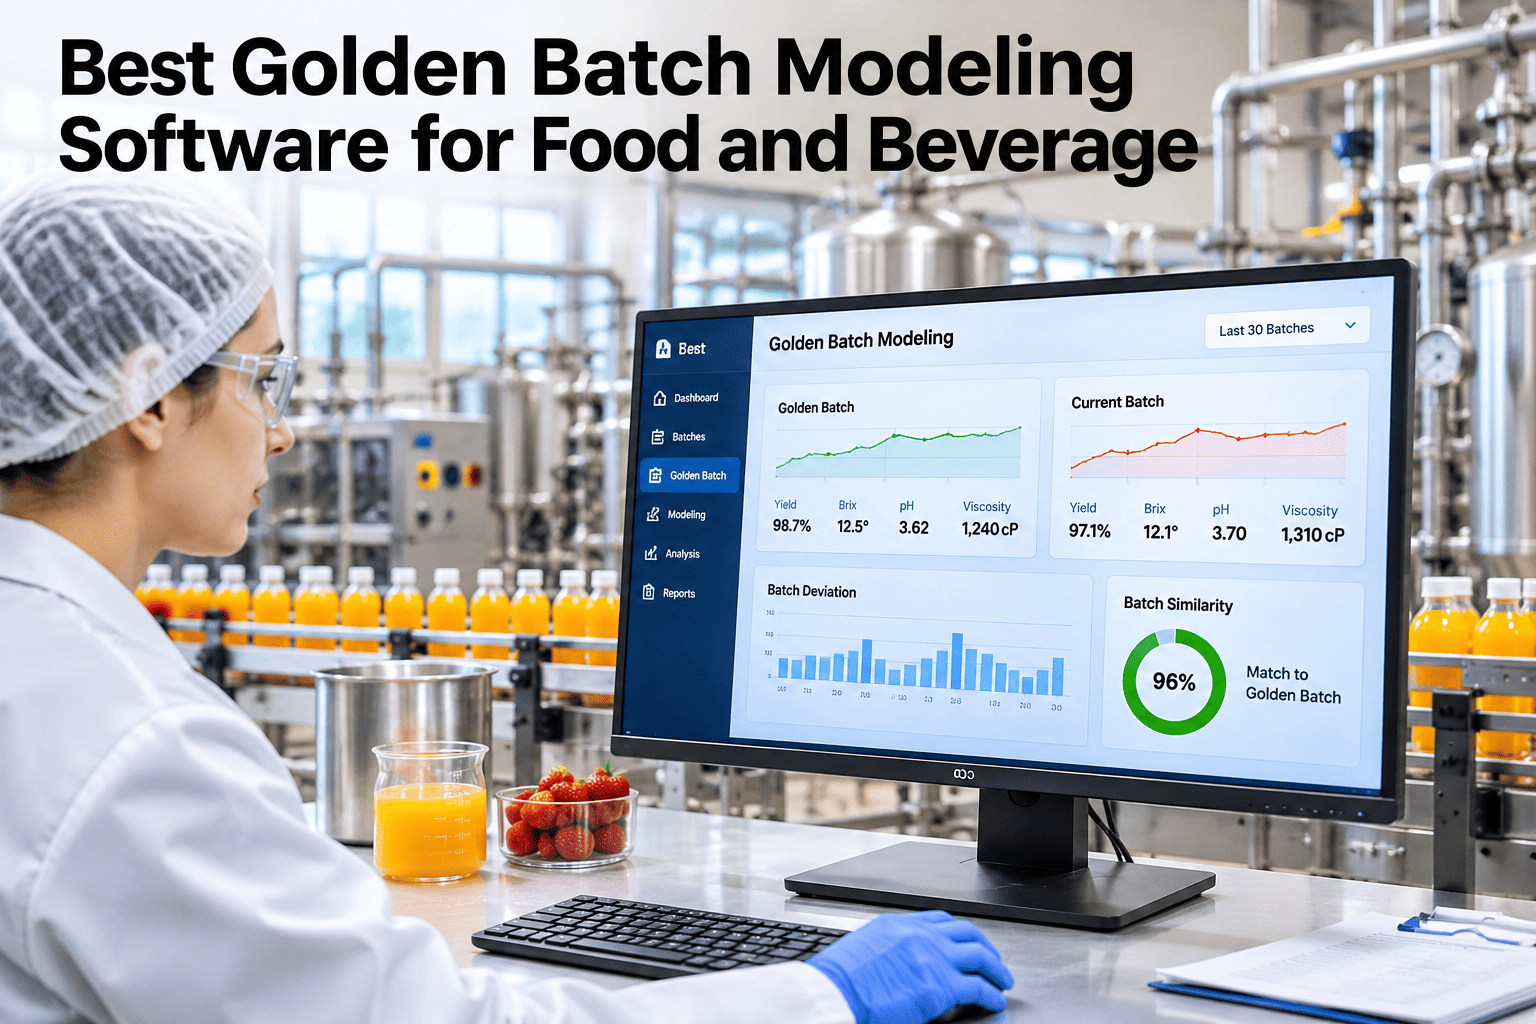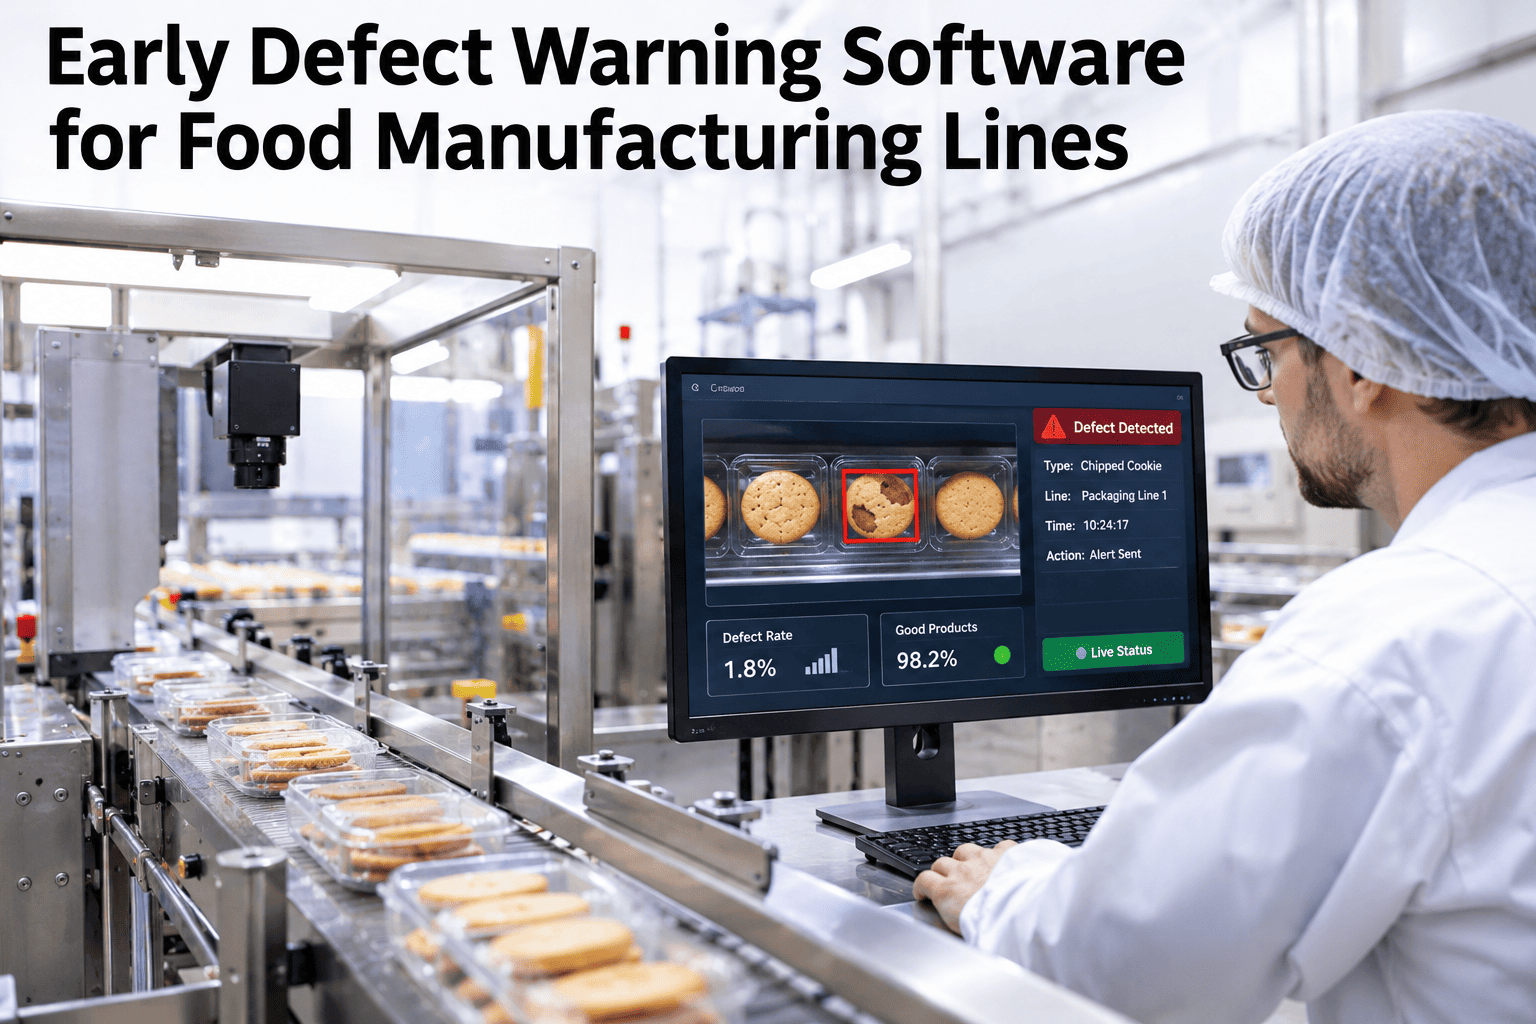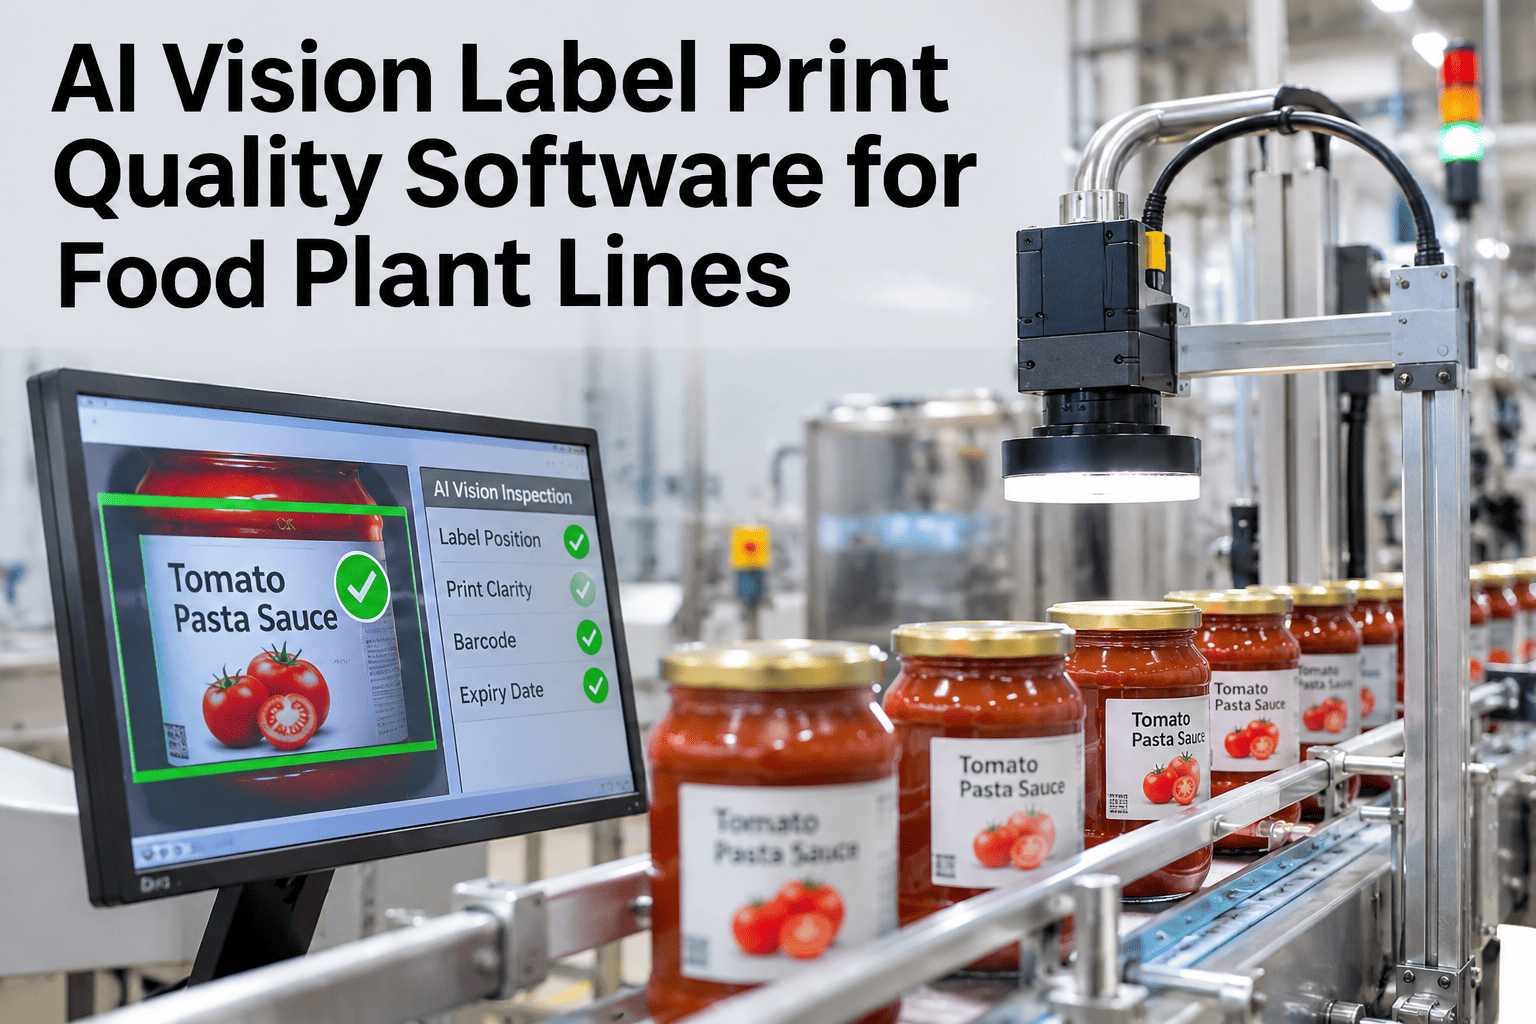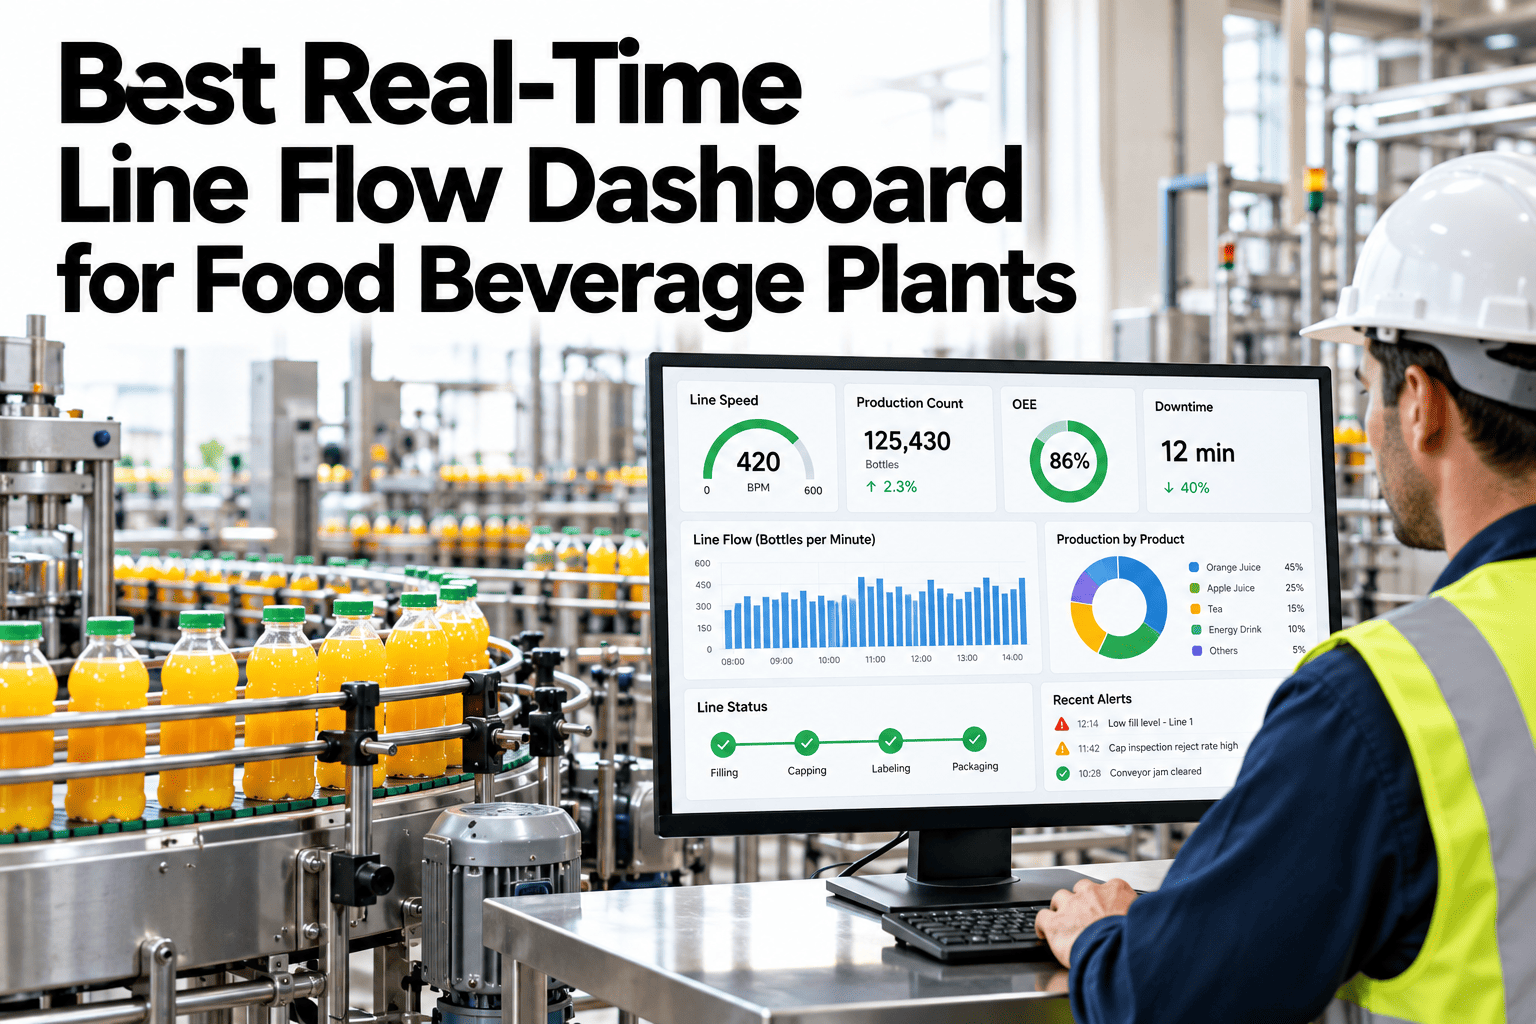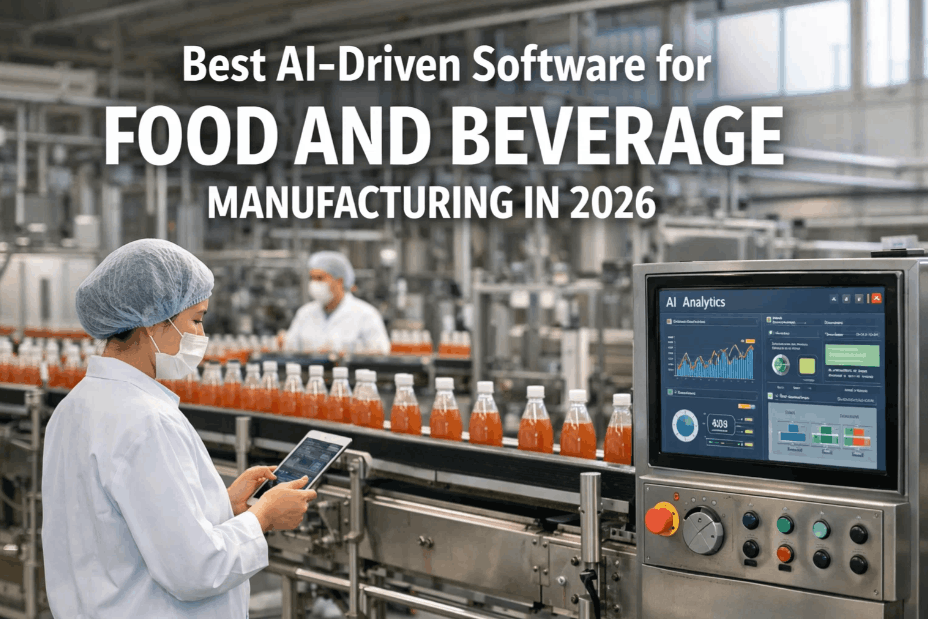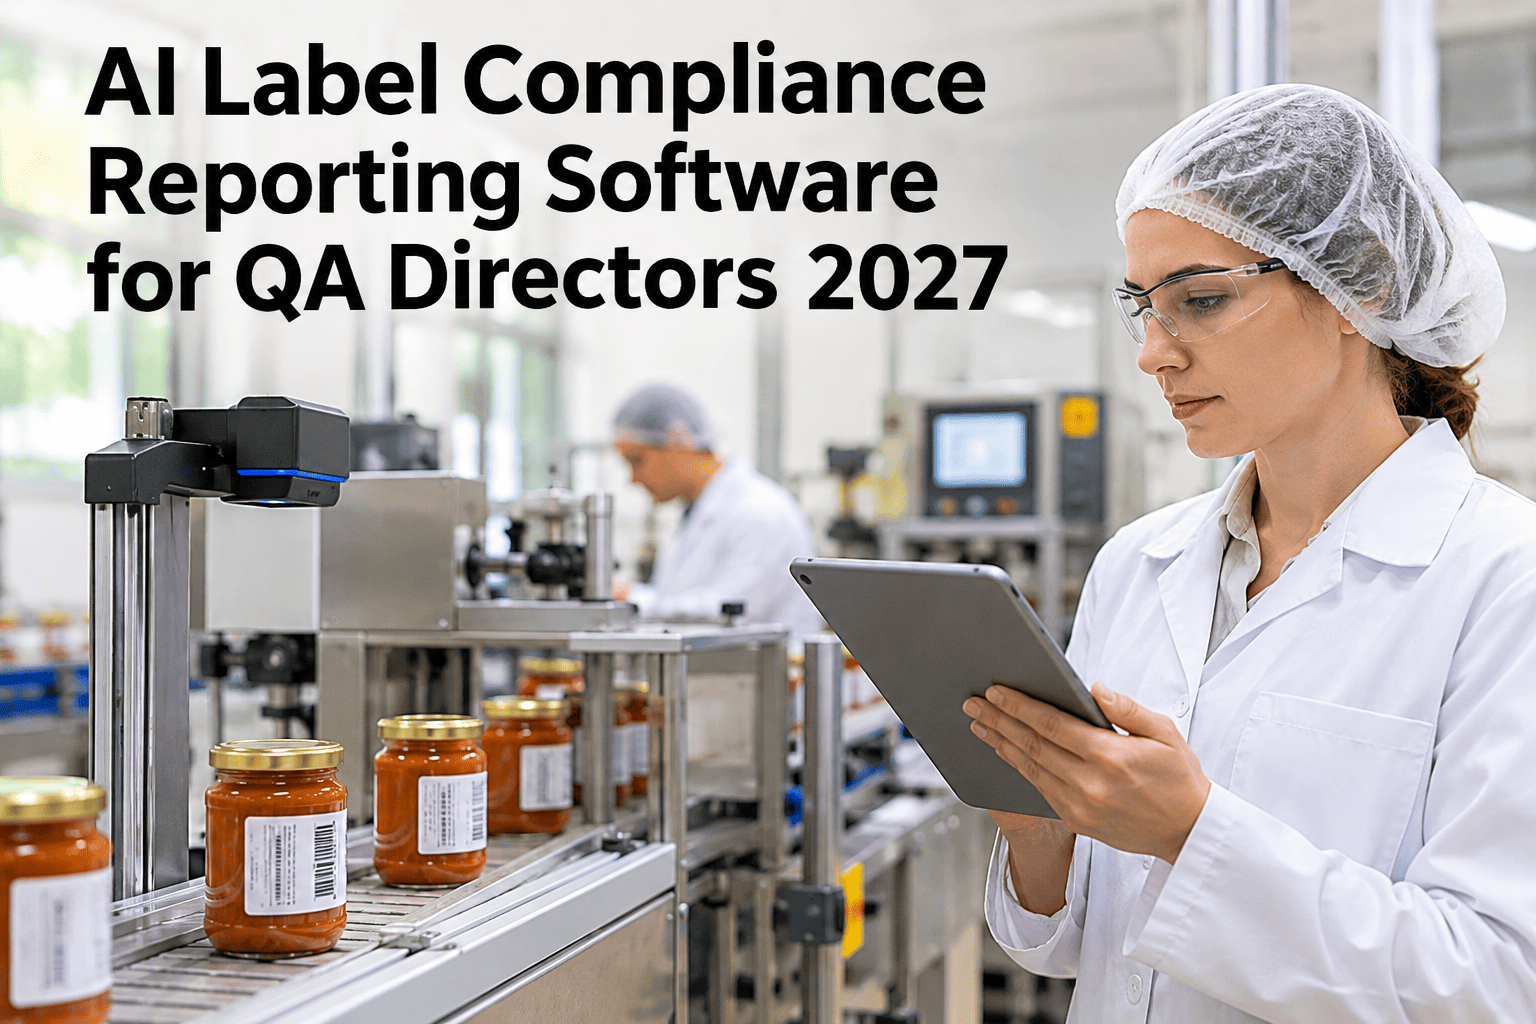
A QA director cannot manage what the label line is not reporting on. Most plants can tell you total downtime but not first-pass label pass rate by SKU, and not which defect code is actually driving the rejects on a given line. Label errors drove 45.5 percent of US food recalls in 2024 at an estimated $1.92 billion cost to the industry (Loftware analysis of FDA enforcement data, 2026). iFactory, an on-premise AI platform with AI Vision Camera and automated analytics reporting built in, tracks first-pass pass rate and defect codes by SKU and line automatically. QA directors who want this reporting on their own lines can request a demo with our team.
First-Pass Label Pass Rate, by SKU and Line, Without Anyone Compiling a Spreadsheet
iFactory AI tracks every label check result automatically, surfacing pass rate and top defect codes the moment a trend starts, not at the end of the month.
Labeling Is the Most Common Recall Cause QA Directors Actually Control
Unlike contamination risk, which often originates upstream in the supply chain, labeling accuracy is almost entirely within a QA director's own process control — the line that prints and applies the label, checked against the specification that was approved. Allergen mislabeling alone accounted for 45.8 percent of 2025 food and beverage recall events (Esko analysis of FDA recall data, 2026).
What Most Label Reporting Is Missing Today
| Common reporting today | What's missing | What AI reporting adds |
|---|---|---|
| Total reject count per shift | No breakdown by SKU or defect type | Pass rate and defect code by SKU, by line, by shift |
| Monthly quality summary | A trend is already weeks old by the time it is reviewed | Live dashboard updated with every label check |
| Operator-logged defects | Inconsistent categorization between operators | Consistent, vision-derived defect codes every time |
The Defect Codes That Actually Drive Most Rejects
Illustrative distribution of label defect categories, representative of patterns seen across food packaging lines rather than a universal fixed ratio.
See What Your Current Reject Data Would Show by SKU
Share a sample of your current label reject logs and iFactory AI will show what a SKU-level and defect-code breakdown would reveal.
Four Steps From a Flagged Trend to a Closed CAPA
Turning Label Data Into a Report a CFO or Plant GM Will Actually Read
A QA director's monthly update is more persuasive with a SKU-level pass rate trend and a ranked defect list than with a single plant-wide reject percentage — it shows exactly where the risk sits and what is being done about it, which matters both internally and in front of an auditor.
What a QA Director Checks First
What QA Directors Ask About Label Compliance Reporting
Give Your QA Team Label Reporting They Can Act On
Book a demo to see first-pass pass rate and top defect codes by SKU and line for your own plant.