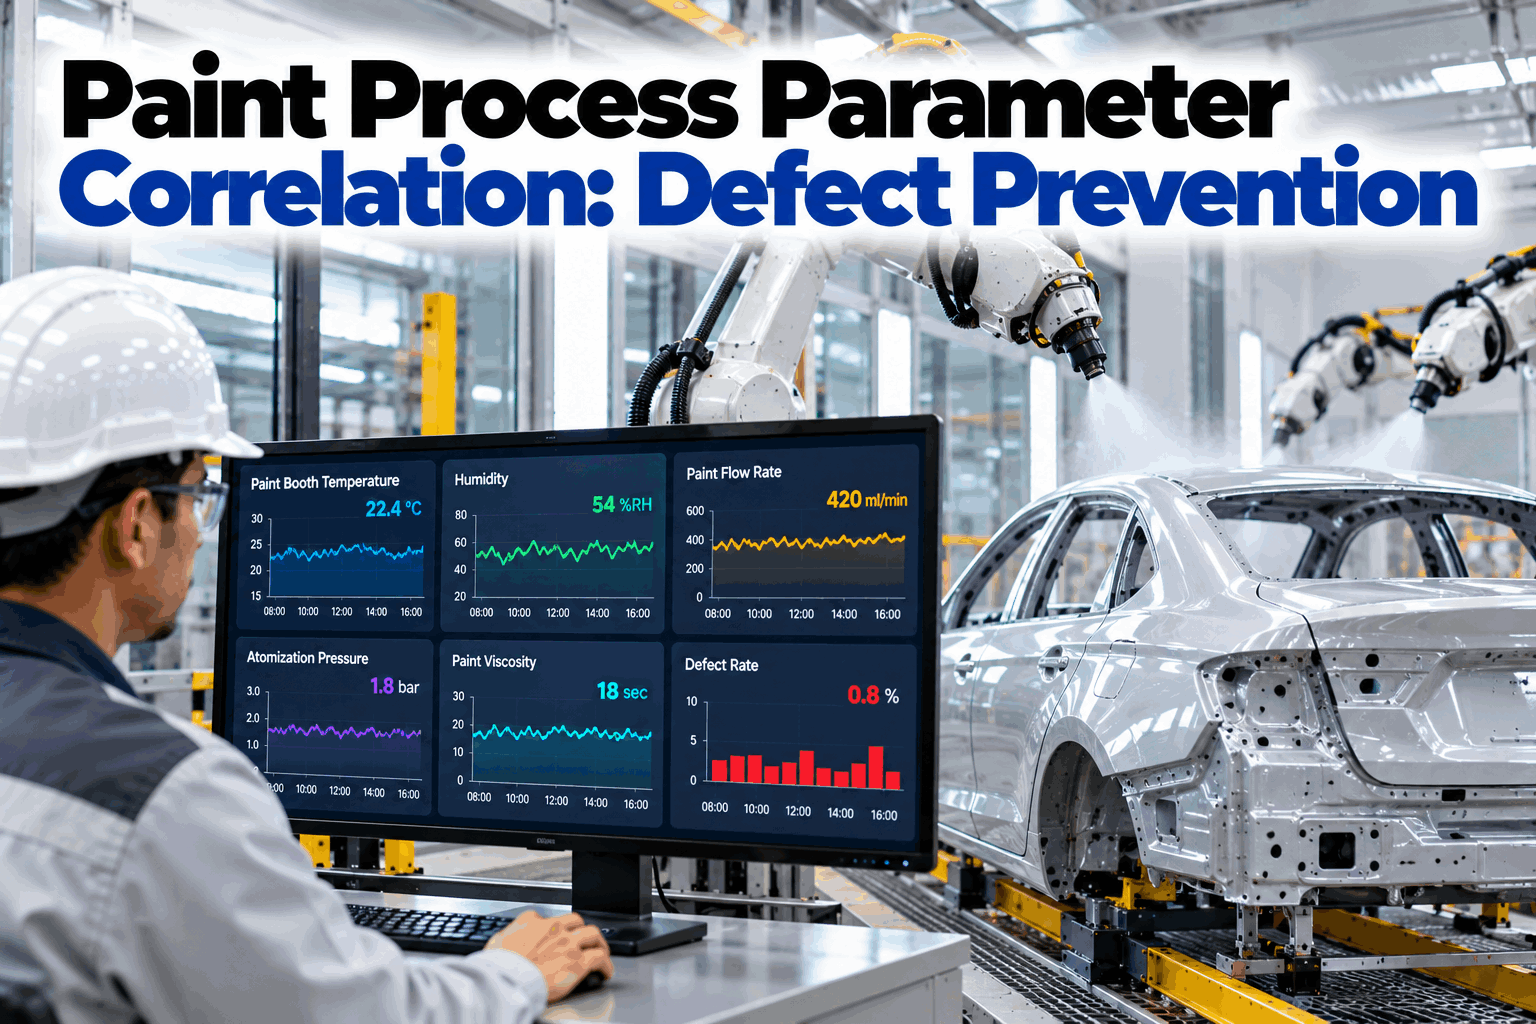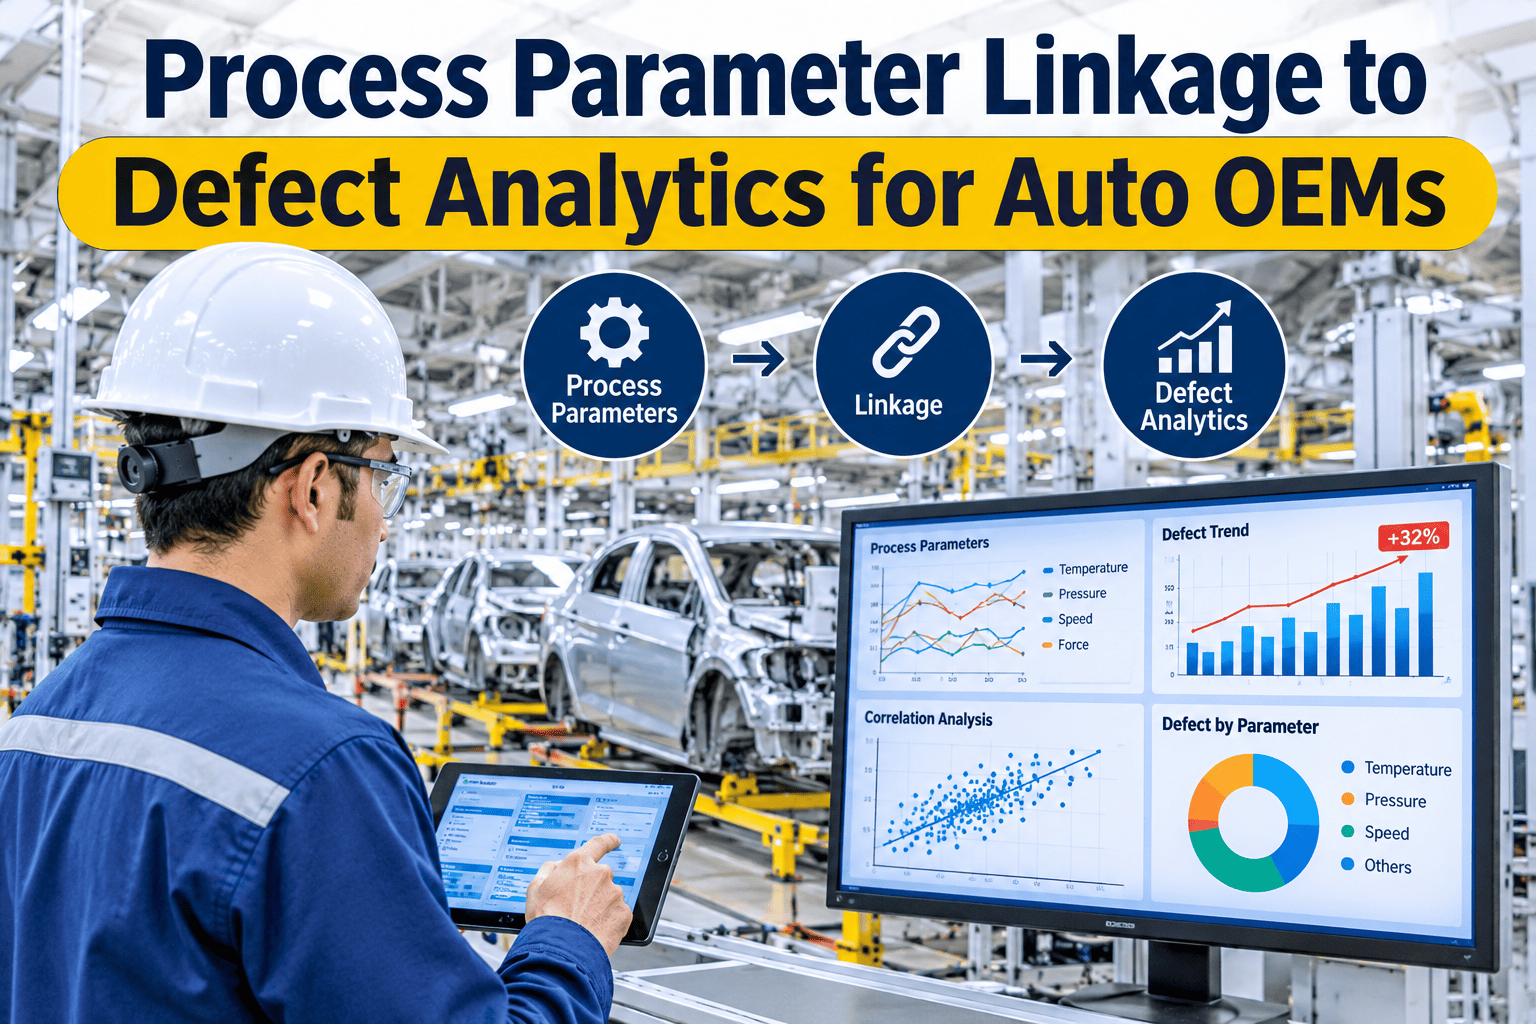
Die temperature, tonnage, stroke count and feed position each tell a small part of a stamping press's story on their own, but a defect rarely has one cause in isolation — it's usually a combination drifting together that crosses a threshold no single parameter would flag by itself. Station-level parameter logging, defect correlation and drift detection connect what a part actually looked like to the exact process conditions that produced it, turning a reject into a data point instead of a mystery. iFactory AI's automotive vision team can correlate your own reject images against PLC parameter history in a short review.
A Defect Rarely Has One Cause — It Has a Combination That Crossed a Line
Station-level parameter logging, parameter-vs-defect correlation and drift detection connect every reject to the exact die temperature, tonnage, stroke count and feed position that produced it.
Why Sample-Based Inspection Misses the Combination
A stamping line inspecting a sample of parts per shift can catch a parameter that has drifted badly, but it has no chance of catching a combination of two or three parameters each individually within tolerance that together push a part out of spec. The cost of missing that combination isn't abstract — a single customer-returned automotive stamping lot commonly runs into five figures before sorting and freight charges, and that cost repeats until the actual combination is identified and corrected.
Easy to catch — one value clearly out of its normal range.
Each parameter individually fine, together pushing the part out of spec.
A sample interval can miss the exact window a combination occurred.
Every part's parameters captured means no window goes unchecked.
Building the Correlation
Correlation only works once every part's image and parameter context are captured together at production speed. Our team can review what your current PLC tags already make available before building a correlation model.
Die temperature, tonnage, stroke count and feed position logged for every cycle.
Vision inspection at production speed tags each part pass or fail, with defect type.
Statistical correlation surfaces which parameter or combination tracks with each defect type.
Once the combination is known, early drift toward it triggers a warning, not a reject.
Manual vs Automated Correlation
| Approach | Time to Isolate Cause | Catches Combination Effects? |
|---|---|---|
| Manual log review and operator interviews | Hours to days | Rarely — too many variables to cross manually |
| Sample-based inspection + manual correlation | Days | Only if the sample happened to catch it |
| 100% inspection + automated correlation | Minutes | Yes — every part's full parameter set is available |
See What's Correlating With Your Own Reject Pattern
Share recent reject images and PLC tag history from one station, and see which parameter or combination tracks with the defect.
A Composite Scenario: The Reject Rate That Came From Two Things at Once
Picture a stamping line with a reject rate that crept upward gradually, with die temperature and tonnage both drifting slightly within what each individually considered an acceptable range.
Correlating defect occurrence against both parameters together, rather than reviewing each in isolation, showed the combination of elevated die temperature and slightly high tonnage was what actually pushed parts out of spec, even though neither alone would have triggered an alarm. Tightening the tonnage setpoint alone closed most of the gap. The scenario illustrates why combination effects matter; actual causes vary by process.
Where iFactory AI Fits
iFactory AI inspects 100% of parts at production speed, logs the full PLC parameter set for every cycle, and runs automated correlation against defect classifications to surface the likely cause and affected part window in minutes rather than days.
Every part classified, not a sample, so no defect window goes unseen.
Die temp, tonnage, stroke count and feed position tied to every part.
Multi-parameter effects surfaced, not just single-value drift.
Frequently Asked Questions
Most stamping and assembly stations already log die temperature, tonnage, stroke count and feed position through their own PLC, so the starting requirement is usually connecting to existing tag data rather than installing new sensors. Check what your current PLC already provides.
Traditional SPC typically tracks one parameter against its own control limits, while parameter-vs-defect correlation looks across multiple parameters simultaneously against actual defect outcomes, which is what catches combination effects SPC alone would miss. Discuss how this complements your SPC program.
Once a correlation model has identified which parameter combination leads to a defect, the same combination trending toward that zone can trigger an early warning, giving operators a chance to adjust before any part is actually rejected. Review early-warning thresholds for your process.
Enough rejects across a range of parameter conditions are needed for the correlation to distinguish a real pattern from coincidence, which for a line with regular reject volume is often achievable within a few weeks of full-inspection data. Scope a data collection window for your station.
It typically layers onto an existing line exit or adds a vision station without replacing current process controls, capturing images and PLC data together rather than requiring a new inspection regime from scratch. Review integration options for your current setup.
Find the Combination, Not Just the One Bad Parameter
iFactory AI inspects every part, captures full parameter context and correlates defects automatically, so a reject becomes a data point instead of a mystery.